| |||||||||||||||||||||||||||||||||
All 35 seats to North Warwickshire Borough Council 18 seats needed for a majority | |||||||||||||||||||||||||||||||||
|---|---|---|---|---|---|---|---|---|---|---|---|---|---|---|---|---|---|---|---|---|---|---|---|---|---|---|---|---|---|---|---|---|---|
| |||||||||||||||||||||||||||||||||
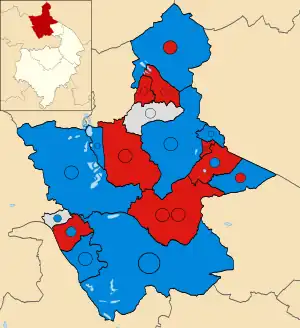 Winner of each seat at the 2023 North Warwickshire Borough Council election | |||||||||||||||||||||||||||||||||
| |||||||||||||||||||||||||||||||||
The 2023 North Warwickshire Borough Council election took place on 4 May 2023, to elect all 35 members of North Warwickshire Borough Council in Warwickshire, England.[1]
Summary
Election result
Following the results, the Conservatives lost the council to no overall control.[2]
| 2023 North Warwickshire Borough Council election[3] | ||||||||||
|---|---|---|---|---|---|---|---|---|---|---|
| Party | Candidates | Seats | Gains | Losses | Net gain/loss | Seats % | Votes % | Votes | +/− | |
| Conservative | 33 | 17 | 1 | 5 | 48.6 | 47.0 | 13,785 | –7.5 | ||
| Labour | 35 | 15 | 4 | 3 | 42.9 | 46.4 | 13,595 | +5.0 | ||
| Independent | 5 | 3 | 3 | 0 | 8.6 | 5.5 | 1,608 | +4.8 | ||
| Green | 1 | 0 | 0 | 0 | 0.0 | 0.5 | 160 | –0.4 | ||
| Heritage | 1 | 0 | 0 | 0 | 0.0 | 0.5 | 151 | N/A | ||
Ward results
Arley and Whitacre
| Party | Candidate | Votes | % | ±% | |
|---|---|---|---|---|---|
| Labour | Jodie Gosling* | 767 | 59.1 | +9.2 | |
| Labour | Michaela Jackson | 623 | 48.0 | +2.2 | |
| Labour | Nigel Turley | 594 | 45.8 | +6.4 | |
| Conservative | Heather Norgrove | 507 | 39.1 | –3.5 | |
| Conservative | Chris Jones | 462 | 35.6 | –5.8 | |
| Conservative | Kerry Parker* | 419 | 32.3 | –13.9 | |
| Heritage | Peter Downes | 151 | 11.6 | N/A | |
| Turnout | 1,297 | 28.9 | |||
| Registered electors | 4,488 | ||||
| Labour hold | |||||
| Labour gain from Conservative | |||||
| Labour hold | |||||
Atherstone Central
| Party | Candidate | Votes | % | ±% | |
|---|---|---|---|---|---|
| Labour | Neil Dirveiks* | 413 | 64.9 | +17.2 | |
| Labour | Rachel Taylor | 403 | 63.4 | +22.7 | |
| Conservative | Mark Jordan | 216 | 34.0 | –4.7 | |
| Conservative | Pauline Gurney | 184 | 28.9 | –4.3 | |
| Turnout | 636 | 22.0 | |||
| Registered electors | 2,895 | ||||
| Labour hold | |||||
| Labour hold | |||||
Atherstone North
| Party | Candidate | Votes | % | ±% | |
|---|---|---|---|---|---|
| Conservative | Ray Jarvis* | 394 | 49.4 | +6.2 | |
| Conservative | Mejar Singh* | 378 | 47.4 | +7.6 | |
| Labour | Derek Pickard | 369 | 46.3 | +9.8 | |
| Labour | Joshua Smith | 350 | 43.9 | +8.2 | |
| Turnout | 797 | 28.1 | |||
| Registered electors | 2,839 | ||||
| Conservative hold | |||||
| Conservative hold | |||||
Atherstone South and Mancetter
| Party | Candidate | Votes | % | ±% | |
|---|---|---|---|---|---|
| Labour | Martin Barnett | 453 | 51.5 | +11.0 | |
| Conservative | Denise Clews* | 421 | 47.9 | –10.8 | |
| Labour | Michael Stanley | 401 | 45.6 | +8.0 | |
| Conservative | Tony Clews* | 399 | 45.4 | –9.7 | |
| Turnout | 879 | 30.0 | |||
| Registered electors | 2,931 | ||||
| Labour gain from Conservative | |||||
| Conservative hold | |||||
Baddesley and Grendon
| Party | Candidate | Votes | % | ±% | |
|---|---|---|---|---|---|
| Conservative | Andy Wright* | 637 | 56.3 | –4.3 | |
| Conservative | Bernadette Davey* | 583 | 51.5 | –5.6 | |
| Labour | Martin Sharp | 482 | 42.6 | +4.1 | |
| Labour | Nathan Sweet | 432 | 38.2 | +2.0 | |
| Turnout | 1,131 | 33.0 | |||
| Registered electors | 3,425 | ||||
| Conservative hold | |||||
| Conservative hold | |||||
Coleshill North
| Party | Candidate | Votes | % | ±% | |
|---|---|---|---|---|---|
| Labour | Jane Farrow* | 400 | 52.5 | +4.4 | |
| Conservative | Peter Fowler | 369 | 48.4 | +4.0 | |
| Labour | Adam Richardson | 339 | 44.5 | –9.4 | |
| Conservative | Colin Lewis | 315 | 41.3 | +0.9 | |
| Turnout | 762 | 30.6 | |||
| Registered electors | 2,494 | ||||
| Labour hold | |||||
| Conservative gain from Labour | |||||
Coleshill South
| Party | Candidate | Votes | % | ±% | |
|---|---|---|---|---|---|
| Conservative | Caroline Symonds* | 533 | 59.8 | +6.3 | |
| Conservative | Colin Hayfield* | 416 | 46.6 | –1.3 | |
| Labour | Alistair Brett | 305 | 34.2 | –2.5 | |
| Labour | Keith Brown | 304 | 34.1 | +1.9 | |
| Turnout | 892 | 32.0 | |||
| Registered electors | 2,786 | ||||
| Conservative hold | |||||
| Conservative hold | |||||
Curdworth
| Party | Candidate | Votes | % | ±% | |
|---|---|---|---|---|---|
| Conservative | Sandra Smith | 566 | 63.7 | –11.7 | |
| Conservative | Martin Watson | 521 | 58.7 | –14.8 | |
| Labour | Celia Banner | 220 | 24.8 | +5.8 | |
| Labour | Michael Banner | 171 | 19.3 | +1.1 | |
| Green | Joshua Harris | 160 | 18.0 | N/A | |
| Turnout | 888 | 33.2 | |||
| Registered electors | 2,675 | ||||
| Conservative hold | |||||
| Conservative hold | |||||
Dordon
| Party | Candidate | Votes | % | ±% | |
|---|---|---|---|---|---|
| Independent | Byron Melia | 411 | 65.6 | N/A | |
| Independent | Davina Ridley | 361 | 57.6 | N/A | |
| Labour | Peter Morson* | 218 | 34.8 | –10.9 | |
| Labour | Alexandra Phillips | 173 | 27.8 | –26.7 | |
| Turnout | 627 | 27.5 | |||
| Registered electors | 2,283 | ||||
| Independent gain from Labour | |||||
| Independent gain from Labour | |||||
Fillongley
| Party | Candidate | Votes | % | ±% | |
|---|---|---|---|---|---|
| Conservative | Mark Simpson | 597 | 70.1 | –4.4 | |
| Conservative | David Wright* | 556 | 65.3 | –0.9 | |
| Labour | John Doyle | 225 | 26.4 | +3.1 | |
| Labour | Daniel Hodkinson | 215 | 25.2 | +3.5 | |
| Turnout | 852 | 31.1 | |||
| Registered electors | 2,744 | ||||
| Conservative hold | |||||
| Conservative hold | |||||
Hartshill
| Party | Candidate | Votes | % | ±% | |
|---|---|---|---|---|---|
| Conservative | Margaret Bell* | 436 | 53.0 | +0.5 | |
| Labour | Katie Holby | 412 | 50.1 | +12.6 | |
| Labour | Elinor Parsons | 345 | 41.9 | +12.0 | |
| Conservative | Marli Parker | 325 | 39.5 | –5.1 | |
| Turnout | 823 | 29.1 | |||
| Registered electors | 2,832 | ||||
| Conservative hold | |||||
| Labour gain from Conservative | |||||
Hurley and Wood End
| Party | Candidate | Votes | % | ±% | |
|---|---|---|---|---|---|
| Labour | Hayden Phillips* | 521 | 57.7 | +3.0 | |
| Labour | Owen Phillips* | 521 | 57.7 | +8.9 | |
| Conservative | John Given | 360 | 39.9 | –3.1 | |
| Conservative | Damien Holt | 302 | 33.4 | –8.6 | |
| Turnout | 903 | 30.5 | |||
| Registered electors | 2,960 | ||||
| Labour hold | |||||
| Labour hold | |||||
Kingsbury
| Party | Candidate | Votes | % | ±% | |
|---|---|---|---|---|---|
| Conservative | Andy Jenns* | 569 | 68.9 | –0.5 | |
| Conservative | Debbie Bates | 410 | 49.6 | –8.8 | |
| Labour | Philip Page | 222 | 26.9 | +4.2 | |
| Labour | Smita Jalaf | 175 | 21.2 | +1.1 | |
| Independent | Suzanne Ayasamy | 111 | 13.4 | –7.0 | |
| Turnout | 826 | 29.0 | |||
| Registered electors | 2,851 | ||||
| Conservative hold | |||||
| Conservative hold | |||||
Newton Regis and Warton
| Party | Candidate | Votes | % | ±% | |
|---|---|---|---|---|---|
| Conservative | Dave Humphreys* | 526 | 48.5 | –8.3 | |
| Labour | Brynnen Ririe | 525 | 48.4 | +5.9 | |
| Conservative | Marian Humphreys* | 520 | 47.9 | –7.1 | |
| Labour | Faye Whapples | 494 | 45.5 | +4.1 | |
| Turnout | 1,085 | 35.1 | |||
| Registered electors | 3,090 | ||||
| Conservative hold | |||||
| Labour gain from Conservative | |||||
Polesworth East
| Party | Candidate | Votes | % | ±% | |
|---|---|---|---|---|---|
| Labour | Dave Parsons* | 532 | 62.8 | –7.0 | |
| Labour | Neil Chapman | 401 | 47.3 | –10.5 | |
| Conservative | Dan Hancocks | 326 | 38.5 | +7.4 | |
| Conservative | Jack Bayley | 269 | 31.8 | +6.8 | |
| Turnout | 847 | 28.9 | |||
| Registered electors | 2,932 | ||||
| Labour hold | |||||
| Labour hold | |||||
Polesworth West
| Party | Candidate | Votes | % | ±% | |
|---|---|---|---|---|---|
| Labour | Emma Whapples | 403 | 56.7 | +8.7 | |
| Labour | Michael Osborne* | 394 | 55.4 | +7.0 | |
| Conservative | Sue Hanratty | 283 | 39.8 | –7.5 | |
| Conservative | Suzanne Hancocks | 267 | 37.6 | –8.8 | |
| Turnout | 711 | 29.0 | |||
| Registered electors | 2,448 | ||||
| Labour hold | |||||
| Labour hold | |||||
Water Orton
| Party | Candidate | Votes | % | ±% | |
|---|---|---|---|---|---|
| Independent | Steve Stuart | 433 | 48.3 | N/A | |
| Conservative | David Reilly* | 384 | 42.9 | –27.8 | |
| Conservative | Michael Lee | 335 | 37.4 | –30.3 | |
| Independent | Feli Freeman | 292 | 32.6 | N/A | |
| Labour | Tom Foley | 164 | 18.3 | –9.8 | |
| Labour | John Broughton | 89 | 9.9 | –9.6 | |
| Turnout | 896 | 33.2 | |||
| Registered electors | 2,701 | ||||
| Independent gain from Conservative | |||||
| Conservative hold | |||||
References
- ↑ "Labour targets rural voters in deepest Warwickshre". BBC News. 2023-04-28. Retrieved 2023-05-07.
- ↑ Suart, Paul (2023-05-05). "Election results as Warwickshire Tories lose key council". CoventryLive. Retrieved 2023-05-07.
- ↑ "North Warwickshire result - Local Elections 2023". BBC News. Retrieved 2023-05-07.
This article is issued from Wikipedia. The text is licensed under Creative Commons - Attribution - Sharealike. Additional terms may apply for the media files.