| |||||||||||||||||||||||||||||||||||||||||||||||||||||||||||||||||
All 48 seats to New Forest District Council 25 seats needed for a majority | |||||||||||||||||||||||||||||||||||||||||||||||||||||||||||||||||
|---|---|---|---|---|---|---|---|---|---|---|---|---|---|---|---|---|---|---|---|---|---|---|---|---|---|---|---|---|---|---|---|---|---|---|---|---|---|---|---|---|---|---|---|---|---|---|---|---|---|---|---|---|---|---|---|---|---|---|---|---|---|---|---|---|---|
| |||||||||||||||||||||||||||||||||||||||||||||||||||||||||||||||||
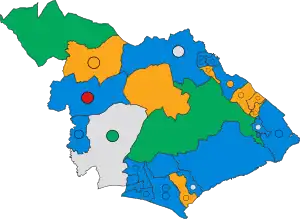 Winner of each seat at the 2023 New Forest District Council election | |||||||||||||||||||||||||||||||||||||||||||||||||||||||||||||||||
| |||||||||||||||||||||||||||||||||||||||||||||||||||||||||||||||||
The 2023 New Forest District Council election took place on 4 May 2023 to elect members of New Forest District Council in Hampshire, England. This was on the same day as other local elections in England.[1]
Prior to the election the council was under Conservative majority control. New ward boundaries came into effect for this election, reducing the number of seats on the council from 60 to 48. The Conservatives retained majority control.[2][3]
Summary
Election result
| 2023 New Forest District election | ||||||||||
|---|---|---|---|---|---|---|---|---|---|---|
| Party | Candidates | Seats | Gains | Losses | Net gain/loss | Seats % | Votes % | Votes | +/− | |
| Conservative | 48 | 26 | N/A | N/A | 54.2 | 42.1 | 34,767 | –16.8 | ||
| Liberal Democrats | 40 | 14 | N/A | N/A | 29.2 | 29.1 | 24,010 | +5.3 | ||
| Independent | 8 | 4 | N/A | N/A | 8.3 | 7.4 | 6,111 | +4.8 | ||
| Green | 14 | 3 | N/A | N/A | 6.3 | 6.9 | 5,713 | +3.7 | ||
| Labour | 46 | 1 | N/A | N/A | 2.1 | 14.3 | 11,795 | +3.5 | ||
| Britain First | 1 | 0 | N/A | N/A | 0.0 | 0.1 | 108 | N/A | ||
Ward Results
The results for each ward were as follows:[4]
Ashley, Bashley and Fernhill
| Party | Candidate | Votes | % | ±% | |
|---|---|---|---|---|---|
| Conservative | Geoffrey Blunden | 981 | 50.3 | ||
| Conservative | Jill Cleary | 972 | 49.8 | ||
| Liberal Democrats | Michael Scott-Johns | 438 | 22.5 | ||
| Liberal Democrats | Simon Morgan | 337 | 17.3 | ||
| Labour | Chloe Bellamy | 308 | 15.8 | ||
| Green | Paul Moxey | 271 | 13.9 | ||
| Labour | Kate Roberts | 244 | 12.5 | ||
| Green | John Pemberton | 149 | 7.6 | ||
| Majority | 534 | ||||
| Turnout | 1,951 | 31 | |||
| Conservative win (new seat) | |||||
| Conservative win (new seat) | |||||
Ashurst, Bramshaw, Copythorne and Netley Marsh
| Party | Candidate | Votes | % | ±% | |
|---|---|---|---|---|---|
| Conservative | Derek Tipp | 1,027 | 46.7 | ||
| Independent | Joe Reilly | 966 | 44.0 | ||
| Conservative | James Hartley-Binns | 740 | 33.7 | ||
| Liberal Democrats | Ben Thompson | 540 | 24.6 | ||
| Labour | Muriel Frend | 350 | 15.9 | ||
| Labour | Tim Mawby | 272 | 12.4 | ||
| Majority | |||||
| Turnout | 2,197 | 36 | |||
| Conservative win (new seat) | |||||
| Independent win (new seat) | |||||
Ballard
| Party | Candidate | Votes | % | ±% | |
|---|---|---|---|---|---|
| Conservative | Neil Tungate | 348 | 40.7 | ||
| Labour | Helen Wallis-Dowling | 167 | 19.6 | ||
| Liberal Democrats | Charles Baker | 137 | 16.0 | ||
| Britain First | Nick Lambert | 108 | 12.6 | ||
| Green | Emily Morgan | 94 | 11.0 | ||
| Majority | 181 | ||||
| Turnout | 854 | 28 | |||
| Conservative win (new seat) | |||||
Barton and Becton
| Party | Candidate | Votes | % | ±% | |
|---|---|---|---|---|---|
| Conservative | Keith Craze | 1,147 | 56.3 | ||
| Conservative | Alan O'Sullivan | 1,087 | 53.3 | ||
| Liberal Democrats | Rainer Preis | 489 | 24.0 | ||
| Liberal Democrats | Sue Lewis | 421 | 20.6 | ||
| Green | Kristina Bourdillon | 310 | 15.2 | ||
| Green | Day Macaskill | 216 | 10.6 | ||
| Labour | Pete Terry | 200 | 9.8 | ||
| Majority | 598 | ||||
| Turnout | 2,039 | 35 | |||
| Conservative win (new seat) | |||||
| Conservative win (new seat) | |||||
Bransgore, Burley, Sopley and Ringwood East
| Party | Candidate | Votes | % | ±% | |
|---|---|---|---|---|---|
| Independent | Nigel Linford | 805 | 41.9 | ||
| Green | Neil Millington | 725 | 37.7 | ||
| Conservative | John Adams | 649 | 33.7 | ||
| Green | Anna Collar | 581 | 30.2 | ||
| Conservative | Dean Samber | 514 | 26.7 | ||
| Labour | Pippa Haywood | 179 | 9.3 | ||
| Labour | Kevin Flack | 130 | 6.8 | ||
| Majority | |||||
| Turnout | 1,923 | 35 | |||
| Independent win (new seat) | |||||
| Green win (new seat) | |||||
Brockenhurst and Denny Lodge
| Party | Candidate | Votes | % | ±% | |
|---|---|---|---|---|---|
| Green | Adam Parker | 671 | 50.9 | ||
| Conservative | Michael Harris | 528 | 40.1 | ||
| Labour | Jon Horne | 118 | 9.0 | ||
| Majority | |||||
| Turnout | 1,317 | 44 | |||
| Green win (new seat) | |||||
Dibden and Dibden Purlieu
| Party | Candidate | Votes | % | ±% | |
|---|---|---|---|---|---|
| Liberal Democrats | Malcolm Wade | 1,025 | 59.6 | ||
| Liberal Democrats | Stephanie Osborne | 874 | 50.8 | ||
| Conservative | Emily Heron | 506 | 29.4 | ||
| Conservative | David Twydell | 455 | 26.5 | ||
| Labour | Leigh Smith | 170 | 9.9 | ||
| Labour | Brian Wilkinson | 137 | 8.0 | ||
| Majority | |||||
| Turnout | 1,720 | 33 | |||
| Liberal Democrats win (new seat) | |||||
| Liberal Democrats win (new seat) | |||||
Downlands and Forest North
| Party | Candidate | Votes | % | ±% | |
|---|---|---|---|---|---|
| Green | Janet Richards | 562 | 49.0 | ||
| Conservative | Annie Bellows | 496 | 43.2 | ||
| Labour | Martin Phillips | 90 | 7.8 | ||
| Majority | |||||
| Turnout | 1,148 | 41 | |||
| Green win (new seat) | |||||
Fawley, Blackfield, Calshot and Langley
| Party | Candidate | Votes | % | ±% | |
|---|---|---|---|---|---|
| Conservative | Alan Alvey | 747 | 50.3 | ||
| Conservative | Matthew Hartmann | 693 | 46.6 | ||
| Liberal Democrats | Angela Pearson | 499 | 33.6 | ||
| Liberal Democrats | Jeni Rose | 451 | 30.3 | ||
| Labour | Patricia Gillam | 214 | 14.4 | ||
| Labour | Michael Garside | 206 | 13.9 | ||
| Majority | |||||
| Turnout | 1,486 | 28 | |||
| Conservative win (new seat) | |||||
| Conservative win (new seat) | |||||
Fordingbridge, Godshill and Hyde
| Party | Candidate | Votes | % | ±% | |
|---|---|---|---|---|---|
| Liberal Democrats | David Millar | 1,118 | 52.7 | ||
| Liberal Democrats | Phil Woods | 1,085 | 51.1 | ||
| Conservative | Ann Sevier | 725 | 34.2 | ||
| Conservative | Robert Heron | 673 | 31.7 | ||
| Labour | Leila Cameron | 270 | 12.7 | ||
| Labour | Jasmine Bessey | 215 | 10.1 | ||
| Majority | |||||
| Turnout | 2,122 | 35 | |||
| Liberal Democrats win (new seat) | |||||
| Liberal Democrats win (new seat) | |||||
Forest and Solent
| Party | Candidate | Votes | % | ±% | |
|---|---|---|---|---|---|
| Conservative | Dan Poole | 554 | 52.8 | ||
| Green | James Gallagher | 380 | 36.2 | ||
| Labour | Vincent Slattery | 116 | 11.0 | ||
| Majority | |||||
| Turnout | 1,050 | 37 | |||
| Conservative win (new seat) | |||||
Hardley, Holbury and North Blackfield
| Party | Candidate | Votes | % | ±% | |
|---|---|---|---|---|---|
| Conservative | Allan Glass | 463 | 35.8 | ||
| Independent | Peter Armstrong | 393 | 30.4 | ||
| Conservative | Josie Poole | 375 | 29.0 | ||
| Independent | Paul Saunders | 253 | 19.6 | ||
| Labour | Sherri Johnstone | 238 | 18.4 | ||
| Liberal Democrats | Sally Read | 236 | 18.3 | ||
| Labour | Ceri Roberts | 221 | 17.1 | ||
| Liberal Democrats | David Cole | 177 | 13.7 | ||
| Majority | |||||
| Turnout | 1,292 | 25 | |||
| Conservative win (new seat) | |||||
| Independent win (new seat) | |||||
Hythe Central
| Party | Candidate | Votes | % | ±% | |
|---|---|---|---|---|---|
| Liberal Democrats | Alex Wade | 1,112 | 56.1 | ||
| Liberal Democrats | Philip Dowd | 970 | 49.0 | ||
| Conservative | Chris Harrison | 741 | 37.4 | ||
| Conservative | Terri Marwood | 685 | 34.6 | ||
| Labour | Ivan Caric | 147 | 7.4 | ||
| Labour | Scott Saffin | 128 | 6.5 | ||
| Majority | |||||
| Turnout | 1,981 | 37 | |||
| Liberal Democrats win (new seat) | |||||
| Liberal Democrats win (new seat) | |||||
Hythe South
| Party | Candidate | Votes | % | ±% | |
|---|---|---|---|---|---|
| Liberal Democrats | Mark Clark | 736 | 55.1 | ||
| Liberal Democrats | Sean Cullen | 704 | 52.7 | ||
| Conservative | Eric Davey | 364 | 27.3 | ||
| Conservative | Brenda Spearing | 346 | 25.9 | ||
| Labour | Clare Davison | 186 | 13.9 | ||
| Labour | Katherine Herbert | 171 | 12.8 | ||
| Majority | |||||
| Turnout | 1,335 | 25 | |||
| Liberal Democrats win (new seat) | |||||
| Liberal Democrats win (new seat) | |||||
Lymington
| Party | Candidate | Votes | % | ±% | |
|---|---|---|---|---|---|
| Conservative | Barry Frank Dunning | 962 | 41.6 | ||
| Independent | Jacqui England | 880 | 38.0 | ||
| Conservative | Simon Smith | 723 | 31.2 | ||
| Liberal Democrats | Hannah Phillips | 586 | 25.3 | ||
| Liberal Democrats | Ted Jearrad | 528 | 22.8 | ||
| Labour | Trina Hart | 348 | 15.0 | ||
| Labour | Jerry Weber | 250 | 10.8 | ||
| Majority | |||||
| Turnout | 2,314 | 37 | |||
| Conservative win (new seat) | |||||
| Independent win (new seat) | |||||
Lyndhurst and Minstead
| Party | Candidate | Votes | % | ±% | |
|---|---|---|---|---|---|
| Liberal Democrats | Hilary Brand | 577 | 48.8 | ||
| Conservative | Brice Stratford | 475 | 40.2 | ||
| Labour | Christopher Arthur Willsher | 130 | 11.0 | ||
| Majority | 1,182 | 40 | |||
| Turnout | |||||
| Liberal Democrats win (new seat) | |||||
Marchwood and Eling
| Party | Candidate | Votes | % | ±% | |
|---|---|---|---|---|---|
| Conservative | Richard Young | 938 | 50.9 | ||
| Liberal Democrats | Patrick Mballa | 776 | 42.1 | ||
| Conservative | Sue Bennison | 694 | 37.7 | ||
| Liberal Democrats | Lindsey Shelley | 685 | 37.2 | ||
| Labour | Kenneth Kershaw | 197 | 10.7 | ||
| Labour | Dave Moran | 194 | 10.5 | ||
| Majority | |||||
| Turnout | 1,842 | 31 | |||
| Conservative win (new seat) | |||||
| Liberal Democrats win (new seat) | |||||
Milford and Hordle
| Party | Candidate | Votes | % | ±% | |
|---|---|---|---|---|---|
| Conservative | David Hawkins | 1,418 | 43.6 | ||
| Conservative | Christine Ward | 1,339 | 41.2 | ||
| Conservative | Alvin Reid | 1,317 | 40.5 | ||
| Independent | Ivor Spreadbury | 1,000 | 30.8 | ||
| Liberal Democrats | Emily Jagger | 936 | 28.8 | ||
| Green | Dominic Boddington | 827 | 25.4 | ||
| Liberal Democrats | Sandra Delemare | 705 | 21.7 | ||
| Labour | Helen Sloan | 488 | 15.0 | ||
| Labour | Stuart Nundy | 335 | 10.3 | ||
| Majority | |||||
| Turnout | 3,250 | 36 | |||
| Conservative win (new seat) | |||||
| Conservative win (new seat) | |||||
| Conservative win (new seat) | |||||
Milton
| Party | Candidate | Votes | % | ±% | |
|---|---|---|---|---|---|
| Conservative | Steve Davies | 822 | 51.1 | ||
| Conservative | Steve Clarke | 810 | 50.4 | ||
| Liberal Democrats | Wyn Davies | 598 | 37.2 | ||
| Liberal Democrats | Jo Drayton | 497 | 30.9 | ||
| Labour | Martin Ashman | 295 | 18.3 | ||
| Majority | |||||
| Turnout | 1,608 | 29 | |||
| Conservative win (new seat) | |||||
| Conservative win (new seat) | |||||
Pennington
| Party | Candidate | Votes | % | ±% | |
|---|---|---|---|---|---|
| Liberal Democrats | Jack Davies | 1,007 | 54.5 | ||
| Liberal Democrats | Colm McCarthy | 785 | 42.5 | ||
| Conservative | Tom Brindley | 612 | 33.1 | ||
| Conservative | Ian Mark Loveless | 541 | 29.3 | ||
| Labour | Bronwen Bridges | 283 | 15.3 | ||
| Labour | Joanna Sawkins | 261 | 14.1 | ||
| Majority | |||||
| Turnout | 1,847 | 30 | |||
| Liberal Democrats win (new seat) | |||||
| Liberal Democrats win (new seat) | |||||
Ringwood North & Ellingham
| Party | Candidate | Votes | % | ±% | |
|---|---|---|---|---|---|
| Conservative | Michael Thierry | 788 | 40.3 | ||
| Labour | John Haywood | 754 | 38.6 | ||
| Labour | Peter Kelleher | 746 | 38.2 | ||
| Conservative | Derek Scott | 726 | 37.2 | ||
| Green | Jerry Fenner | 253 | 12.9 | ||
| Liberal Democrats | Luke Dadford | 248 | 12.7 | ||
| Liberal Democrats | Liz Barron | 224 | 11.5 | ||
| Majority | |||||
| Turnout | 1,954 | 32 | |||
| Conservative win (new seat) | |||||
| Labour win (new seat) | |||||
Ringwood South
| Party | Candidate | Votes | % | ±% | |
|---|---|---|---|---|---|
| Conservative | Jeremy Heron | 534 | 29.4 | ||
| Conservative | Stephen Rippon-Swaine | 517 | 28.4 | ||
| Labour | James Swyer | 487 | 26.8 | ||
| Labour | Glenys Turner | 482 | 26.5 | ||
| Independent | Philip Day | 481 | 26.4 | ||
| Independent | Gareth Deboos | 464 | 25.5 | ||
| Green | Timothy Rowe | 187 | 10.3 | ||
| Liberal Democrats | Jeremy Allen | 180 | 9.9 | ||
| Liberal Democrats | Cameron McDonald | 144 | 7.9 | ||
| Majority | |||||
| Turnout | 1,819 | 31 | |||
| Conservative win (new seat) | |||||
| Conservative win (new seat) | |||||
Sway
| Party | Candidate | Votes | % | ±% | |
|---|---|---|---|---|---|
| Conservative | Barry Rickman | 737 | 55.3 | ||
| Green | Simon Graham King | 487 | 36.6 | ||
| Labour | Peter Francis John Dance | 108 | 8.1 | ||
| Majority | |||||
| Turnout | 1,332 | 46 | |||
| Conservative win (new seat) | |||||
Totton Central
| Party | Candidate | Votes | % | ±% | |
|---|---|---|---|---|---|
| Conservative | John Sleep | 647 | 36.1 | ||
| Conservative | Ian Murray | 596 | 33.3 | ||
| Liberal Democrats | Stephen Shepherd | 568 | 31.7 | ||
| Liberal Democrats | Matt Kangarani | 555 | 31.0 | ||
| Labour | Adrian Johnstone | 330 | 18.4 | ||
| Labour | David Edward Smith | 287 | 16.0 | ||
| Independent | Ian Coombes | 243 | 13.6 | ||
| Independent | Frances Orchard | 180 | 10.1 | ||
| Majority | |||||
| Turnout | 1,791 | 32 | |||
| Conservative win (new seat) | |||||
| Conservative win (new seat) | |||||
Totton North
| Party | Candidate | Votes | % | ±% | |
|---|---|---|---|---|---|
| Conservative | Neville Penman | 1,054 | 50.4 | ||
| Conservative | Dave Penny | 814 | 38.9 | ||
| Conservative | Kathleen Crisell | 774 | 37.0 | ||
| Liberal Democrats | Lin Francis | 505 | 24.1 | ||
| Liberal Democrats | Alex Brunsdon | 501 | 23.9 | ||
| Liberal Democrats | Steve Hardingson | 457 | 21.8 | ||
| Labour | Lynne Garrick | 340 | 16.3 | ||
| Labour | Roland Bishop | 333 | 15.9 | ||
| Labour | Kenneth Garrick | 322 | 15.4 | ||
| Independent | Ron Scrivens | 229 | 10.9 | ||
| Independent | Chris Lagdon | 217 | 10.4 | ||
| Majority | |||||
| Turnout | 2,092 | 25 | |||
| Conservative win (new seat) | |||||
| Conservative win (new seat) | |||||
| Conservative win (new seat) | |||||
Totton South
| Party | Candidate | Votes | % | ±% | |
|---|---|---|---|---|---|
| Liberal Democrats | David Harrison | 904 | 54.8 | ||
| Liberal Democrats | Caroline Louise Rackham | 695 | 42.1 | ||
| Conservative | Lisa Tracy Carter | 607 | 36.8 | ||
| Conservative | Len Harris | 506 | 30.7 | ||
| Labour | Alan Goodfellow | 191 | 11.6 | ||
| Labour | Kit Rogers | 157 | 9.5 | ||
| Majority | |||||
| Turnout | 1,649 | 27 | |||
| Liberal Democrats win (new seat) | |||||
| Liberal Democrats win (new seat) | |||||
References
- ↑ "New Forest candidates in the local elections on May 4". Daily Echo. Retrieved 2023-05-04.
- ↑ "Local elections 2023: Tories keep control of New Forest District Council but lose BCP Council". Lymington Times. May 5, 2023. Retrieved May 6, 2023.
- ↑ "Local elections 2023: Conservatives lose grip on Hampshire stronghold". BBC News. 5 May 2023. Retrieved 25 September 2023.
- ↑ "District election results". New Forest District Council. Retrieved 25 September 2023.
This article is issued from Wikipedia. The text is licensed under Creative Commons - Attribution - Sharealike. Additional terms may apply for the media files.