| Woking | |
|---|---|
| Borough constituency for the House of Commons | |
 Boundary of Woking in Surrey | |
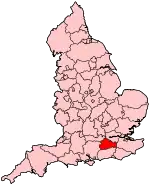 Location of Surrey within England | |
| County | Surrey |
| Electorate | 75,424 (December 2019) |
| Major settlements | Brookwood, Byfleet, Woking |
| Current constituency | |
| Created | 1950 |
| Member of Parliament | Jonathan Lord (Conservative) |
| Created from | Chertsey and Farnham |
Woking is a constituency represented in the House of Commons of the UK Parliament since 2010 by Jonathan Lord, a Conservative. Since it was first created for the 1950 general election, it has only ever returned Conservative Party candidates.
Constituency profile
The seat includes all of Woking Borough plus the two Guildford Borough villages of Pirbright and Normandy. There is an Armed Forces presence at Pirbright Camp and the Ash Ranges. Voters are wealthier than the UK average.[1]
History
It was created in 1950 from the county constituencies of Chertsey and lightly populated parts of Farnham.[n 1]
With exceptions in 1974 (February election), 1997, 2005 and 2010, when the majority was less, Woking has returned a Conservative candidate whose majority has exceeded 15% of the votes cast. At both the 2015 and 2017 general elections, the Labour candidates polled in second place. In 2019, the Lib Dems moved into second place. During the history of the constituency since it was formed in 1950, the Labour Party has been the runner-up in ten general elections and the Liberals/Lib Dems have also been runners-up ten times. Jonathan Lord has been the MP for the constituency since 2010.
The narrowest margin of victory was 11.2% of the vote, in 1997, its most marginal result. By contrast, at the 2015 general election the seat was the 41st-safest of the Conservative Party's 331 seats by percentage of majority, with the Conservatives fully 40 percentage points ahead of Labour.[2]
The Liberal Democrats currently have a sizeable majority on Woking Borough Council and there is one strong Labour-voting ward (Canalside), but historically the Conservatives have been the dominant force on Woking Borough Council. The Conservatives have also consistently won both of the Guildford Borough Council wards of Pirbright and Normandy over many election cycles, but these two wards become part of the Surrey Heath constituency at the next General Election due to boundary changes.
Boundaries
- 1950–74: The Urban Districts of Frimley and Camberley, and Woking, and in the Rural District of Guildford the parishes of Ash, Normandy, and Pirbright.
- 1974–83: as above less Frimley and Camberley. Note in 1974 the areas became parts of Woking (borough) and Guildford (borough).
- 1983–97: unchanged (i.e. The Borough of Woking, and the Borough of Guildford wards of Ash, Ash Vale, Normandy, and Pirbright.)
- 1997–present: as above less Ash and Ash Vale
The 1974-recipient seat of Frimley and Camberley was North West Surrey (abolished in 1997). The 1997-recipient of Ash and Ash Vale was Surrey Heath. The constituency is based around the town of Woking in Surrey. The Boundary Commission for England made no boundary changes for Woking in the review before the 2010 general election.
Proposed
Further to the 2023 Periodic Review of Westminster constituencies, enacted by the Parliamentary Constituencies Order 2023, the composition of the constituency from the next general election, due by January 2025, will be reduced further by transferring the Pirbright and Normandy wards to the constituency of Surrey Heath. The boundaries will now be coterminous with those of the Borough of Woking.[3]
Members of Parliament
| Election | Member[4] | Party | |
|---|---|---|---|
| 1950 | Harold Watkinson | Conservative | |
| 1964 | Sir Cranley Onslow | Conservative | |
| 1997 | Humfrey Malins | Conservative | |
| 2010 | Jonathan Lord | Conservative | |
Elections
Elections in the 2010s
| Party | Candidate | Votes | % | ±% | |
|---|---|---|---|---|---|
| Conservative | Jonathan Lord | 26,396 | 48.9 | –5.2 | |
| Liberal Democrats | Will Forster | 16,629 | 30.8 | +13.2 | |
| Labour | Gerry Mitchell | 8,827 | 16.4 | –7.5 | |
| Green | Ella Walding | 1,485 | 2.8 | +0.8 | |
| UKIP | Troy de Leon | 600 | 1.1 | –1.0 | |
| Majority | 9,767 | 18.1 | –12.1 | ||
| Turnout | 53,937 | 71.5 | –1.0 | ||
| Registered electors | 75,455 | ||||
| Conservative hold | Swing | –9.3 | |||
| Party | Candidate | Votes | % | ±% | |
|---|---|---|---|---|---|
| Conservative | Jonathan Lord | 29,903 | 54.1 | -2.1 | |
| Labour | Fiona Colley | 13,179 | 23.9 | +7.8 | |
| Liberal Democrats | Will Forster | 9,711 | 17.6 | +6.0 | |
| UKIP | Troy de Leon | 1,161 | 2.1 | -9.2 | |
| Green | James Brierley | 1,092 | 2.0 | -2.1 | |
| Independent | Hassan Akberali | 200 | 0.4 | New | |
| Majority | 16,724 | 30.2 | -9.8 | ||
| Turnout | 55,246 | 72.5 | +2.5 | ||
| Conservative hold | Swing | -4.9 | |||
| Party | Candidate | Votes | % | ±% | |
|---|---|---|---|---|---|
| Conservative | Jonathan Lord | 29,199 | 56.2 | +5.9 | |
| Labour | Jill Rawling | 8,389 | 16.1 | +8.1 | |
| Liberal Democrats | Chris Took | 6,047 | 11.6 | −25.8 | |
| UKIP | Rob Burberry | 5,873 | 11.3 | +7.5 | |
| Green | Martin Robson | 2,109 | 4.1 | New | |
| CISTA | Declan Wade | 229 | 0.4 | New | |
| Magna Carta Conservation Party Great Britain | Ruth Temple | 77 | 0.1 | New | |
| The Evolution Party | Angela Woolford | 41 | 0.1 | New | |
| Majority | 20,810 | 40.0 | +27.1 | ||
| Turnout | 51,964 | 70.0 | −1.5 | ||
| Conservative hold | Swing | −1.1 | |||
| Party | Candidate | Votes | % | ±% | |
|---|---|---|---|---|---|
| Conservative | Jonathan Lord | 26,551 | 50.3 | +2.9 | |
| Liberal Democrats | Rosie Sharpley | 19,744 | 37.4 | +4.3 | |
| Labour | Tom Miller | 4,246 | 8.0 | −8.3 | |
| UKIP | Rob Burberry | 1,997 | 3.8 | +0.9 | |
| Peace | Julie Roxburgh | 204 | 0.4 | New | |
| Magna Carta Conservation Party Great Britain | Ruth Temple | 44 | 0.1 | New | |
| Majority | 6,807 | 12.9 | −1.5 | ||
| Turnout | 52,786 | 71.5 | +8.1 | ||
| Conservative hold | Swing | −0.7 | |||
Elections in the 2000s
| Party | Candidate | Votes | % | ±% | |
|---|---|---|---|---|---|
| Conservative | Humfrey Malins | 21,838 | 47.4 | +1.4 | |
| Liberal Democrats | Anne Lee | 15,226 | 33.1 | +2.8 | |
| Labour | Ellie Blagbrough | 7,507 | 16.3 | −4.0 | |
| UKIP | Matthew Davies | 1,324 | 2.9 | −0.5 | |
| UK Community Issues Party | Michael Osman | 150 | 0.3 | New | |
| Majority | 6,612 | 14.4 | -1.3 | ||
| Turnout | 46,045 | 63.4 | +3.2 | ||
| Conservative hold | Swing | −0.7 | |||
| Party | Candidate | Votes | % | ±% | |
|---|---|---|---|---|---|
| Conservative | Humfrey Malins | 19,747 | 46.0 | +7.6 | |
| Liberal Democrats | Alan Hilliar | 12,988 | 30.3 | +3.0 | |
| Labour | Sabir Hussain | 8,714 | 20.3 | −0.7 | |
| UKIP | Michael Harvey | 1,461 | 3.4 | +2.4 | |
| Majority | 6,759 | 15.7 | +4.6 | ||
| Turnout | 42,910 | 60.2 | −12.5 | ||
| Conservative hold | Swing | +2.3 | |||
Elections in the 1990s
| Party | Candidate | Votes | % | ±% | |
|---|---|---|---|---|---|
| Conservative | Humfrey Malins | 19,553 | 38.4 | −20.7 | |
| Liberal Democrats | Philip Goldenberg | 13,875 | 27.3 | +0.2 | |
| Labour | Katie Hanson | 10,695 | 21.0 | +7.6 | |
| Ind. Conservative | Hugh Bell | 3,933 | 7.7 | New | |
| Referendum | Christopher Skeate | 2,209 | 4.3 | New | |
| UKIP | Michael Harvey | 512 | 1.0 | New | |
| Natural Law | Deirdre Sleeman | 137 | 0.3 | -0.2 | |
| Majority | 5,678 | 11.1 | -19.9 | ||
| Turnout | 50,914 | 72.7 | -6.5 | ||
| Conservative hold | Swing | -10.3 | |||
This constituency underwent boundary changes between the 1992 and 1997 general elections and thus change in share of vote is based on a notional calculation.
| Party | Candidate | Votes | % | ±% | |
|---|---|---|---|---|---|
| Conservative | Cranley Onslow | 37,744 | 58.9 | +0.8 | |
| Liberal Democrats | Dorothy A. Buckrell | 17,902 | 28.0 | −3.4 | |
| Labour | James M. Dalgleish | 8,080 | 12.6 | +2.1 | |
| Natural Law | Teresa A. Macintyre | 302 | 0.5 | New | |
| Majority | 19,842 | 31.0 | +4.3 | ||
| Turnout | 64,028 | 79.2 | +4.1 | ||
| Conservative hold | Swing | +2.1 | |||
Elections in the 1980s
| Party | Candidate | Votes | % | ±% | |
|---|---|---|---|---|---|
| Conservative | Cranley Onslow | 35,990 | 58.1 | −0.2 | |
| Alliance (Liberal) | Philip Goldenberg | 19,446 | 31.4 | +2.0 | |
| Labour | Anita Pollack | 6,537 | 10.5 | −1.2 | |
| Majority | 16,544 | 26.7 | −2.2 | ||
| Turnout | 61,973 | 75.1 | +3.4 | ||
| Conservative hold | Swing | -1.1 | |||
| Party | Candidate | Votes | % | ±% | |
|---|---|---|---|---|---|
| Conservative | Cranley Onslow | 32,748 | 58.3 | +1.3 | |
| Alliance (Liberal) | Philip Goldenberg | 16,511 | 29.4 | +11.4 | |
| Labour | Barbara Broer | 6,566 | 11.7 | -6.3 | |
| Party of Associates with Licensees | D. M. Comens | 368 | 0.6 | New | |
| Majority | 16,237 | 28.9 | -4.2 | ||
| Turnout | 56,193 | 71.7 | -4.8 | ||
| Conservative hold | Swing | -5.1 | |||
Elections in the 1970s
| Party | Candidate | Votes | % | ±% | |
|---|---|---|---|---|---|
| Conservative | Cranley Onslow | 31,719 | 57.05 | +11.01 | |
| Labour | Nigel Beard | 13,327 | 23.97 | +0.27 | |
| Liberal | George H. Dunk | 9,991 | 17.97 | -10.43 | |
| National Front | P. A. Gleave | 564 | 1.01 | -0.85 | |
| Majority | 18,392 | 33.08 | +15.44 | ||
| Turnout | 55,601 | 76.51 | +3.58 | ||
| Conservative hold | Swing | +5.4 | |||
| Party | Candidate | Votes | % | ±% | |
|---|---|---|---|---|---|
| Conservative | Cranley Onslow | 22,804 | 46.04 | -0.29 | |
| Liberal | P. Wade | 14,069 | 28.40 | -4.01 | |
| Labour | J. W. Tattersall | 11,737 | 23.70 | +2.44 | |
| National Front | R. Vaughan-Smith | 921 | 1.86 | New | |
| Majority | 8,735 | 17.64 | +3.72 | ||
| Turnout | 49,531 | 72.93 | -7.94 | ||
| Conservative hold | Swing | +1.9 | |||
| Party | Candidate | Votes | % | ±% | |
|---|---|---|---|---|---|
| Conservative | Cranley Onslow | 25,243 | 46.33 | -10.38 | |
| Liberal | P. Wade | 17,660 | 32.41 | +17.54 | |
| Labour | J. W. Tattersall | 11,583 | 21.26 | -7.16 | |
| Majority | 7,583 | 13.92 | -14.37 | ||
| Turnout | 54,486 | 80.87 | +10.99 | ||
| Conservative hold | Swing | -14.0 | |||
| Party | Candidate | Votes | % | ±% | |
|---|---|---|---|---|---|
| Conservative | Cranley Onslow | 37,220 | 56.71 | +5.31 | |
| Labour | R. M. Taylor | 18,652 | 28.42 | -2.38 | |
| Liberal | P. Wade | 9,763 | 14.87 | -2.93 | |
| Majority | 18,568 | 28.29 | +7.69 | ||
| Turnout | 65,635 | 69.88 | -7.23 | ||
| Conservative hold | Swing | +3.8 | |||
Elections in the 1960s
| Party | Candidate | Votes | % | ±% | |
|---|---|---|---|---|---|
| Conservative | Cranley Onslow | 32,057 | 51.40 | -0.30 | |
| Labour | Michael Downing | 19,210 | 30.80 | +1.22 | |
| Liberal | Agnes H. Scott | 11,104 | 17.80 | -0.92 | |
| Majority | 12,847 | 20.60 | -1.52 | ||
| Turnout | 62,371 | 77.11 | -0.98 | ||
| Conservative hold | Swing | -0.8 | |||
| Party | Candidate | Votes | % | ±% | |
|---|---|---|---|---|---|
| Conservative | Cranley Onslow | 31,170 | 51.70 | -15.70 | |
| Labour | H. G. N. Clother | 17,834 | 29.58 | -3.02 | |
| Liberal | Agnes H. Scott | 11,285 | 18.72 | New | |
| Majority | 13,336 | 22.12 | -12.68 | ||
| Turnout | 60,289 | 78.09 | +0.74 | ||
| Conservative hold | Swing | -6.3 | |||
Elections in the 1950s
| Party | Candidate | Votes | % | ±% | |
|---|---|---|---|---|---|
| Conservative | Harold Watkinson | 33,521 | 67.40 | +2.99 | |
| Labour | R David Vaughan Williams | 16,210 | 32.60 | -2.99 | |
| Majority | 17,311 | 34.80 | +5.98 | ||
| Turnout | 49,731 | 77.35 | +1.63 | ||
| Conservative hold | Swing | +3.0 | |||
| Party | Candidate | Votes | % | ±% | |
|---|---|---|---|---|---|
| Conservative | Harold Watkinson | 27,860 | 64.41 | -0.54 | |
| Labour | R David Vaughan Williams | 15,393 | 35.59 | +0.54 | |
| Majority | 12,467 | 28.82 | -1.08 | ||
| Turnout | 43,253 | 75.72 | -3.01 | ||
| Conservative hold | Swing | -0.5 | |||
| Party | Candidate | Votes | % | ±% | |
|---|---|---|---|---|---|
| Conservative | Harold Watkinson | 26,522 | 64.95 | +6.97 | |
| Labour | W. Eric Wolff | 14,313 | 35.05 | +3.86 | |
| Majority | 12,209 | 29.90 | +3.11 | ||
| Turnout | 40,835 | 78.73 | -4.51 | ||
| Conservative hold | Swing | +1.6 | |||
| Party | Candidate | Votes | % | ±% | |
|---|---|---|---|---|---|
| Conservative | Harold Watkinson | 24,454 | 57.98 | ||
| Labour | T. Davies | 13,157 | 31.19 | ||
| Liberal | Michael Fernley Turner-Bridger | 4,567 | 10.83 | ||
| Majority | 11,297 | 26.79 | |||
| Turnout | 42,178 | 83.24 | |||
| Conservative hold | Swing | ||||
See also
Notes
- ↑ All extant UK seats elect one Member of Parliament (MP) by the first past the post system of election, as from the outset in Woking in 1950
References
- ↑ Electoral Calculus https://www.electoralcalculus.co.uk/fcgi-bin/seatdetails.py?seat=Woking
- ↑ "Conservative Members of Parliament 2015". UK Political.info. Archived from the original on 8 June 2017. Retrieved 12 February 2017.
- ↑ "The Parliamentary Constituencies Order 2023". Schedule 1 Part 6 South East region.
- ↑ Leigh Rayment's Historical List of MPs – Constituencies beginning with "W" (part 5)
- ↑ "Statement of Persons Nominated, Notice of Poll and Situation of Polling Stations" (PDF). Woking Borough Council. 14 November 2019. Retrieved 14 November 2019.
- ↑ "Woking Parliamentary constituency". BBC News Online. 13 December 2019. Retrieved 13 December 2019.
- ↑ "Known candidates for Woking in the 2017 general election". Democracy Club. 12 May 2017. Archived from the original on 14 May 2017. Retrieved 14 May 2017.
- ↑ "Election Data 2015". Electoral Calculus. Archived from the original on 17 October 2015. Retrieved 17 October 2015.
- ↑ "UK 2015 general election results in full". The Guardian. 8 May 2015. Retrieved 14 May 2017.
- ↑ "Election Data 2010". Electoral Calculus. Archived from the original on 26 July 2013. Retrieved 17 October 2015.
- ↑ "Election Data 2005". Electoral Calculus. Archived from the original on 15 October 2011. Retrieved 18 October 2015.
- ↑ "Election Data 2001". Electoral Calculus. Archived from the original on 15 October 2011. Retrieved 18 October 2015.
- ↑ "Election Data 1997". Electoral Calculus. Archived from the original on 15 October 2011. Retrieved 18 October 2015.
- ↑ "Election Data 1992". Electoral Calculus. Archived from the original on 15 October 2011. Retrieved 18 October 2015.
- ↑ "Politics Resources". Election 1992. Politics Resources. 9 April 1992. Retrieved 6 December 2010.
- ↑ "Election Data 1987". Electoral Calculus. Archived from the original on 15 October 2011. Retrieved 18 October 2015.
- ↑ "Election Data 1983". Electoral Calculus. Archived from the original on 15 October 2011. Retrieved 18 October 2015.
Sources
- "Election result, 2015". BBC News Online.
- "Election result, 2010". BBC News Online.
- "Election result, 2005". BBC News Online.
- "Election results, 1997–2001". BBC News Online.
- "Election results, 1997–2001". Election Demon.
- "Election results, 1983–1992". Election Demon.
- "Election results, 1950–1979". Politics Resources.