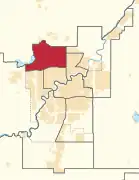
.svg.png.webp) Location of St. Albert—Edmonton within Edmonton | |||
| Federal electoral district | |||
| Legislature | House of Commons | ||
| MP |
Conservative | ||
| District created | 2013 | ||
| First contested | 2015 | ||
| Last contested | 2021 | ||
| District webpage | profile, map | ||
| Demographics | |||
| Population (2011)[1] | 105,162 | ||
| Electors (2019) | 92,579 | ||
| Area (km²)[2] | 104 | ||
| Pop. density (per km²) | 1,011.2 | ||
| Census division(s) | Division No. 11 | ||
| Census subdivision(s) | Edmonton, St. Albert | ||
St. Albert—Edmonton is a federal electoral district in Alberta, Canada, that has been represented in the House of Commons of Canada since 2015.
St. Albert—Edmonton was created by the 2012 federal electoral boundaries redistribution and was legally defined in the 2013 representation order. It came into effect upon the call of the 42nd Canadian federal election, scheduled for October 2015.[3] It was created out of the district of Edmonton—St. Albert.[4]
History
Historical boundaries
 2003 representation order (as Edmonton—St. Albert)
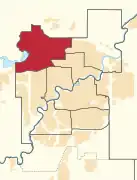 2013 representation order
Members of Parliament
This riding has elected the following members of the House of Commons of Canada:
| Parliament | Years | Member | Party | |
|---|---|---|---|---|
| St. Albert—Edmonton Riding created from Edmonton—St. Albert |
||||
| 43rd | 2015–2021 | Michael Cooper | Conservative | |
| 43rd | 2015–2021 | |||
| 44th | 2021–present | |||
Demographics
| Panethnic group | 2021[6] | 2016[7] | 2011[8] | |||||||||||
|---|---|---|---|---|---|---|---|---|---|---|---|---|---|---|
| Pop. | % | Pop. | % | Pop. | % | |||||||||
| European[lower-alpha 1] | 84,565 | 65.9% | 85,760 | 71.95% | 81,015 | 77.82% | ||||||||
| Southeast Asian[lower-alpha 2] | 9,265 | 7.22% | 6,955 | 5.83% | 4,735 | 4.55% | ||||||||
| African | 7,470 | 5.82% | 4,870 | 4.09% | 2,335 | 2.24% | ||||||||
| Middle Eastern[lower-alpha 3] | 7,370 | 5.74% | 5,600 | 4.7% | 3,750 | 3.6% | ||||||||
| Indigenous | 6,885 | 5.37% | 5,215 | 4.38% | 3,970 | 3.81% | ||||||||
| East Asian[lower-alpha 4] | 4,920 | 3.83% | 4,425 | 3.71% | 4,210 | 4.04% | ||||||||
| South Asian | 4,400 | 3.43% | 3,705 | 3.11% | 2,420 | 2.32% | ||||||||
| Latin American | 1,390 | 1.08% | 1,185 | 0.99% | 705 | 0.68% | ||||||||
| Other/multiracial[lower-alpha 5] | 2,040 | 1.59% | 1,485 | 1.25% | 955 | 0.92% | ||||||||
| Total responses | 128,315 | 98.08% | 119,195 | 98.25% | 104,100 | 98.94% | ||||||||
| Total population | 130,822 | 100% | 121,313 | 100% | 105,216 | 100% | ||||||||
| Notes: Totals greater than 100% due to multiple origin responses. Demographics based on 2012 Canadian federal electoral redistribution riding boundaries. | ||||||||||||||
Election results
Graph of election results in St. Albert—Edmonton (minor parties that never got 2% of the vote or didn't run consistently are omitted)
| 2021 Canadian federal election | ||||||||
|---|---|---|---|---|---|---|---|---|
| Party | Candidate | Votes | % | ±% | Expenditures | |||
| Conservative | Michael Cooper | 29,652 | 47.6 | -13.09 | $38,825.53 | |||
| New Democratic | Kathleen Mpulubusi | 17,816 | 28.6 | +13.4 | $5,805.37 | |||
| Liberal | Greg Springate | 11,188 | 17.9 | -1.27 | $10,378.80 | |||
| People's | Brigitte Cecelia | 3,684 | 5.9 | +3.95 | $5,576.45 | |||
| Total valid votes/Expense limit | 62,340 | 99.46 | -0.03 | $122,114.60 | ||||
| Total rejected ballots | 338 | 0.54 | +0.03 | |||||
| Turnout | 62,678 | 66.34 | -3.66 | |||||
| Eligible voters | 94,477 | |||||||
| Conservative hold | Swing | -13.25 | ||||||
| Source: Elections Canada[9] | ||||||||
| 2019 Canadian federal election | ||||||||
|---|---|---|---|---|---|---|---|---|
| Party | Candidate | Votes | % | ±% | Expenditures | |||
| Conservative | Michael Cooper | 39,506 | 60.69 | +15.46 | $33,538.36 | |||
| Liberal | Greg Springate | 12,477 | 19.17 | -3.37 | $10,807.28 | |||
| New Democratic | Kathleen Mpulubusi | 9,895 | 15.20 | +4.04 | $832.26 | |||
| Green | Rob Dunbar | 1,594 | 2.45 | +1.06 | $7,613.82 | |||
| People's | Brigitte Cecelia | 1,268 | 1.95 | - | none listed | |||
| Veterans Coalition | Robert Bruce Fraser | 336 | 0.5 | - | none listed | |||
| Total valid votes/expense limit | 65,091 | 99.49 | ||||||
| Total rejected ballots | 336 | 0.51 | +0.27 | |||||
| Turnout | 65,427 | 70.00 | +0.32 | |||||
| Eligible voters | 93,468 | |||||||
| Conservative hold | Swing | +9.41 | ||||||
| Source: Elections Canada[10][11] | ||||||||
| 2015 Canadian federal election | ||||||||
|---|---|---|---|---|---|---|---|---|
| Party | Candidate | Votes | % | ±% | Expenditures | |||
| Conservative | Michael Cooper | 26,783 | 45.24 | -19.24 | $57,186.82 | |||
| Liberal | Beatrice Ghettuba | 13,383 | 22.54 | +11.70 | $12,254.31 | |||
| Independent | Brent Rathgeber | 11,652 | 19.68 | n/a | $50,607.26 | |||
| New Democratic | Darlene Malayko | 6,609 | 11.16 | -8.92 | $14,243.93 | |||
| Green | Andrea Oldham | 821 | 1.39 | -3.22 | – | |||
| Total valid votes/expense limit | 59,208 | 99.75 | $220,664.92 | |||||
| Total rejected ballots | 146 | 0.25 | – | |||||
| Turnout | 59,354 | 69.67 | – | |||||
| Eligible voters | 85,187 | |||||||
| Conservative hold | Swing | -15.47 | ||||||
| Source: Elections Canada[12][13] | ||||||||
| 2011 federal election redistributed results[14] | |||
|---|---|---|---|
| Party | Vote | % | |
| Conservative | 27,626 | 64.48 | |
| New Democratic | 8,601 | 20.08 | |
| Liberal | 4,642 | 10.84 | |
| Green | 1,974 | 4.61 | |
Notes
- ↑ Statistic includes all persons that did not make up part of a visible minority or an indigenous identity.
- ↑ Statistic includes total responses of "Filipino" and "Southeast Asian" under visible minority section on census.
- ↑ Statistic includes total responses of "West Asian" and "Arab" under visible minority section on census.
- ↑ Statistic includes total responses of "Chinese", "Korean", and "Japanese" under visible minority section on census.
- ↑ Statistic includes total responses of "Visible minority, n.i.e." and "Multiple visible minorities" under visible minority section on census.
References
- ↑ Statistics Canada: 2011
- ↑ Statistics Canada: 2011
- ↑ Timeline for the Redistribution of Federal Electoral Districts
- ↑ Report – Alberta
- ↑ "Election Night Results - Electoral Districts".
- ↑ Government of Canada, Statistics Canada (October 26, 2022). "Census Profile, 2021 Census of Population". www12.statcan.gc.ca. Retrieved September 21, 2023.
- ↑ Government of Canada, Statistics Canada (October 27, 2021). "Census Profile, 2016 Census". www12.statcan.gc.ca. Retrieved September 21, 2023.
- ↑ Government of Canada, Statistics Canada (November 27, 2015). "NHS Profile". www12.statcan.gc.ca. Retrieved September 21, 2023.
- ↑ "List of confirmed candidates – September 20, 2021 Federal Election". Elections Canada. Retrieved September 2, 2021.
- ↑ "List of confirmed candidates". Elections Canada. Retrieved October 4, 2019.
- ↑ "Official Voting Results". Elections Canada. Retrieved July 19, 2021.
- ↑ "Official Voting Results". Elections Canada. February 29, 2016. Retrieved July 19, 2021.
- ↑ Elections Canada – Preliminary Election Expenses Limits for Candidates
- ↑ Pundits' Guide to Canadian Elections
This article is issued from Wikipedia. The text is licensed under Creative Commons - Attribution - Sharealike. Additional terms may apply for the media files.