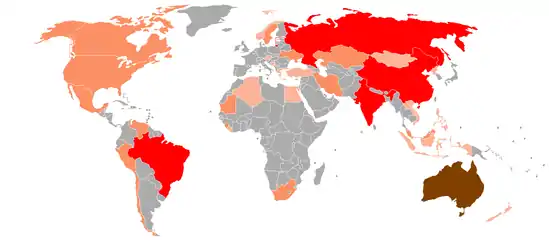
World iron ore production (thousands of tonnes) in 2013/2015:
500,000+
100,000–500,000
10,000–99,999
1,000–9,999
0–999
This is a list of countries by iron ore production based on U.S. Geological Survey data.[lower-alpha 1]
List
| Rank | Country | Usable iron ore production (1000 tonnes) | Year |
|---|---|---|---|
| World | 2,500,000 | 2022 | |
| 1 | 880,000 | 2023 | |
| 2 | 659,000 | 2023 | |
| 2 | 422,000 | 2023 | |
| 4 | 285,000 | 2023 | |
| 5 | 99,000 | 2019 | |
| 6 | 77,000 | 2019 | |
| 7 | 62,000 | 2019 | |
| 8 | 54,000 | 2019 | |
| 9 | 48,000 | 2019 | |
| 10 | 43,000 | 2019 | |
| 11 | 38,000 | 2019 | |
| 12 | 37,000 | 2019 | |
| 13 | 23,000 | 2019 | |
| 14 | 15,000 | 2019 | |
| 15 | 14,000 | 2019 | |
| 16 | 13,300 | 2017 | |
| 17 | 12,000 | 2017 | |
| 18 | 9,570 | 2017 | |
| 19 | 7,695 | 2017 | |
| 20 | 6,700 | 2017 | |
| 21 | 5,250 | 2017 | |
| 22 | 4,720 | 2017 | |
| 23 | 3,920 | 2017 | |
| 24 | 3,490 | 2017 | |
| 25 | 2,800 | 2017 | |
| 26 | 2,284 | 2017 | |
| 27 | 1,930 | 2017 | |
| 28 | 1,622 | 2017 | |
| 29 | 715 | 2017 | |
| 30 | 600 | 2017 | |
| 31 | 547 | 2017 | |
| 32 | 500 | 2017 | |
| 33 | 310 | 2017 | |
| 34 | 200 | 2017 | |
| 35 | 110 | 2017 | |
| 36 | 60 | 2017 | |
| 37 | 28 | 2017 | |
| 38 | 15 | 2017 | |
Pig iron production
This is a list of countries by pig iron production.
| Rank | Country | 1980 | 2013 | 2015 |
|---|---|---|---|---|
| World | 506 | 1,168 | 1,180 | |
| 1 | 38 | 709 | 710 | |
| 2 | 87 | 84 | 84 | |
| 3 | 85 | 50 | 54 | |
| 4 | n/a | 50 | 51 | |
| 5 | 5.6 | 41 | 47 | |
| 6 | 13 | 26 | 30 | |
| 7 | 36 | 27 | 28 | |
| 8 | 62 | 30 | 26 | |
| 9 | n/a | 29 | 25 | |
| 10 | 6.2 | 9.4 | 9 | |
| other countries | 246 | 91 | 101 | |
See also
Notes
- ↑ Data in the article is as of 2019, since iron ore production in many countries declined during the COVID-19 pandemic and hasn't fully recovered to pre-pandemic levels.
References
- ↑ "Mineral Commodity Summaries 2020" (PDF). U.S. Geological Survey. Retrieved 2020-07-30.
- ↑ 2017 Annual Tables. USGS. 2019-11-18.
- ↑ "Global iron ore production data; Clarification of reporting from the USGS" (PDF). U.S. Geological Survey. Retrieved 2017-08-21.
- ↑ "World Steel Production 1980-2013" (PDF). World Steel Association. Nov 2014. Archived from the original (PDF) on 20 April 2015. Retrieved 4 April 2015.
- ↑ USGS 2016
This article is issued from Wikipedia. The text is licensed under Creative Commons - Attribution - Sharealike. Additional terms may apply for the media files.