The Regional Snowfall Index (RSI) is a system used by NOAA to assess the societal impact of winter storms in the United States. The system is a replacement for the Northeast Snowfall Impact Scale (NESIS) system. Since its initiation, the NCDC has retroactively assigned RSI values to over 500 historical storms since 1900.
Storms are ranked from category zero ("Nuisance") to five ("Extreme") on the scale. The impact of the storms is assessed in six different regions of the United States: Northeast, Northern Rockies & Plains, Ohio Valley, South, Southeast, and Upper Midwest.[1] A category five Extreme ranking is indicated by a numerical score of 18 or higher on the scale.
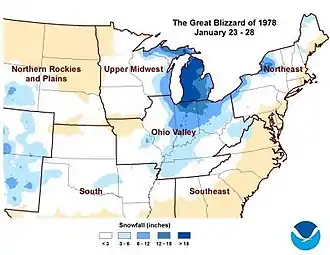
Out of the over 500 historical storms assessed since 1900, only 26 storms have been given a category five ranking. The highest ranking storm on the list is the Great Blizzard of 1978, which scored a value of 39.07. The most recent storm to receive a category five ranking is the January 2016 United States blizzard, which scored a value of 20.14. The following list orders the storms chronologically.[1][2][3]
List of Category 5 events
| Year | Date | Max. RSI | Region | Ref(s) |
|---|---|---|---|---|
| 1920 | April 14–18 | 20.84 | Northern Rockies and Plains | [4] |
| 1921 | February 17–21 | 31.89 | South | [4] |
| 1922 | January 25–29 | 18.53 | Southeast | [4] |
| 1927 | February 26 – March 2 | 24.42 | Southeast | [4] |
| 1927 | April 4–10 | 34.20 | Northern Rockies and Plains | [4] |
| 1929 | December 18–23 | 21.13 | South | [4] |
| 1940 | January 20–23 | 18.14 | Southeast | [4] |
| 1943 | January 18–25 | 21.14 | Northern Rockies and Plains | [4] |
| 1950 | November 11–21 | 34.69 | Ohio Valley | [4] |
| 1966 | February 27 – March 5 | 20.38 | Northern Rockies and Plains | [4] |
| 1967 | January 24–28 | 18.13 | Ohio Valley | [4] |
| 1969 | February 21–27 | 34.03 | Northeast | [4] |
| 1971 | February 18–23 | 19.36 | South | [4] |
| 1978 | January 22–27 | 39.07 | Upper Midwest, Ohio Valley | [4] |
| 1978 | February 5–7 | 18.42 | Northeast | [4] |
| 1984 | April 24–27 | 25.95 | Northern Rockies and Plains | [4] |
| 1985 | February 6–14 | 27.06 | Upper Midwest | [4] |
| 1985 | November 27 – December 1 | 22.19 | Upper Midwest | [4] |
| 1988 | January 4–8 | 22.64 | South | [4] |
| 1991 | October 30 – November 3 | 30.18 | Upper Midwest | [4] |
| 1993 | March 11–14 | 24.63 | Northeast, Ohio Valley, Southeast | [4] |
| 1993 | November 20–28 | 22.00 | Northern Rockies and Plains | [4] |
| 1996 | January 5–8 | 26.37 | Northeast, Southeast | [4] |
| 2009 | December 21–28 | 19.62 | Northern Rockies and Plains | [4] |
| 2011 | January 31 – February 2 | 21.99 | Ohio Valley | [4] |
| 2016 | January 19 – January 29 | 20.14 | Northeast | [4] |
Listed by month
|

|
See also
References
- 1 2 "Regional Snowfall Index (RSI)". NOAA: National Centers for Environmental Information. Retrieved 16 February 2016.
- ↑ "Regional Snowfall Index and Societal Impacts". Retrieved 2014-11-18.
- ↑ "NOAA Product Highlight: Regional Snowfall Index". Archived from the original on 2014-11-29. Retrieved 2014-11-18.
- 1 2 3 4 5 6 7 8 9 10 11 12 13 14 15 16 17 18 19 20 21 22 23 24 25 26 27 Squires, Michael; Lawrinmore, Jay; Heim, Richard; Robinson, David; Gerbush, Mathieu; Estilow, Thomas. "The Regional Snowfall Index" (PDF). American Meteorological Society. Retrieved 22 July 2017.