.svg.png.webp)
Brazilian states by life expectancy (2022).
> 82
81.99 – 81.00
80.99 – 78.80
78.79 – 77.00
76.99 – 74.5
< 74.5

Development of life expectancy in Brazil according to estimation of the World Bank Group

Life expectancy with calculated gender gap

Life expectancy in Brazil according to estimation of the Our World in Data

Development of life expectancy in Brazil in comparison to other big countries of South America

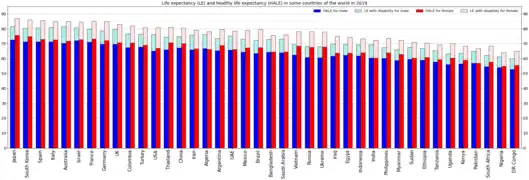
Life expectancy and healthy life expectancy in Brazil on the background of other countries of the world in 2019
Life expectancy and healthy life expectancy for males and females
There are 26 States of Brazil, or Estados in Portuguese, which are the federal states of Brazil, plus the Federal District which holds the capital city, Brasília. The second number in bold corresponds to the map. This and the figures below are based on 2022 estimate data, the life expectancy at birth for women being 81.23 years and for men 74.30, with an average of 77.76 years expected at birth, both sexes combined.
| State | Overall[1] | Rank | Men[1] | Rank | Women[1] | Rank |
|---|---|---|---|---|---|---|
| Santa Catarina | 82.51 | 1 | 79.33 | 1 | 85.69 | 1 |
| Espírito Santo | 81.63 | 2 | 77.94 | 3 | 85.33 | 2 |
| São Paulo | 81.26 | 3 | 78.46 | 2 | 84.07 | 5 |
| Distrito Federal | 81.11 | 4 | 77.73 | 5 | 84.48 | 3 |
| Rio Grande do Sul | 81.00 | 5 | 77.80 | 4 | 84.20 | 4 |
| Paraná | 80.53 | 6 | 77.18 | 7 | 83.89 | 6 |
| Minas Gerais | 80.42 | 7 | 77.67 | 6 | 83.17 | 7 |
| Rio de Janeiro | 79.45 | 8 | 76.39 | 8 | 82.52 | 9 |
| Rio Grande do Norte | 79.17 | 9 | 75.50 | 9 | 82.84 | 8 |
| Mato Grosso do Sul | 78.80 | 10 | 75.30 | 10 | 82.31 | 10 |
| Pernambuco | 77.62 | 11 | 74.10 | 14 | 81.14 | 12 |
| Mato Grosso | 77.62 | 12 | 74.36 | 12 | 80.88 | 13 |
| Acre | 77.49 | 13 | 74.21 | 13 | 80.77 | 14 |
| Amapá | 77.16 | 14 | 74.72 | 11 | 79.60 | 21 |
| Goiás | 76.97 | 15 | 73.69 | 16 | 80.26 | 17 |
| Ceará | 76.87 | 16 | 73.01 | 18 | 80.75 | 15 |
| Tocantins | 76.81 | 17 | 73.75 | 15 | 79.87 | 20 |
| Paraíba | 76.78 | 18 | 73.07 | 17 | 80.49 | 16 |
| Bahia | 76.75 | 19 | 72.24 | 20 | 81.26 | 11 |
| Sergipe | 75.90 | 20 | 71.72 | 21 | 80.07 | 18 |
| Alagoas | 75.40 | 21 | 70.75 | 25 | 80.06 | 19 |
| Roraima | 75.28 | 22 | 73.00 | 19 | 77.56 | 27 |
| Pará | 75.21 | 23 | 71.14 | 24 | 79.29 | 22 |
| Amazonas | 75.18 | 24 | 71.72 | 22 | 78.65 | 23 |
| Rondônia | 74.50 | 25 | 71.25 | 23 | 77.75 | 26 |
| Maranhão | 74.11 | 26 | 70.38 | 26 | 77.84 | 25 |
| Piauí | 74.00 | 27 | 69.67 | 27 | 78.33 | 24 |
See also
Wikimedia Commons has media related to Life expectancy charts for Brazil.
References
- 1 2 3 IBGE, Síntese de Indicadores Sociais 2007 : Publicação completa Archived 2015-03-19 at the Wayback Machine. Tabela 1.4 - Taxa de fecundidade total, taxa bruta de natalidade, taxa bruta de mortalidade, taxa de mortalidade infantil e esperança de vida ao nascer, por sexo, segundo as Grandes Regiões e Unidades da Federação - 2022.
External links
Lists of Brazilian federative units | |
|---|---|
| Geography | |
| Politics | |
| Economy | |
| Demographics | |
| Miscellaneous | |
This article is issued from Wikipedia. The text is licensed under Creative Commons - Attribution - Sharealike. Additional terms may apply for the media files.