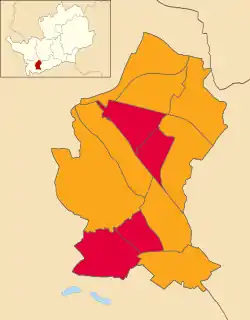
Map showing the results of the 2021 Watford Borough Council election
The 2021 Watford Borough Council election took place on 6 May 2021 to elect members of Watford Borough Council in England.[1] This was the same day as other local elections.
Results summary
| 2021 Watford Borough Council election[2] | ||||||||||
|---|---|---|---|---|---|---|---|---|---|---|
| Party | This election | Full council | This election | |||||||
| Seats | Net | Seats % | Other | Total | Total % | Votes | Votes % | +/− | ||
| Liberal Democrats | 8 | 66.7 | 18 | 26 | 72.2 | 12,103 | 44.0 | -11.2 | ||
| Labour | 4 | 33.3 | 6 | 10 | 27.8 | 7,868 | 28.6 | -0.4 | ||
| Conservative | 0 | 0.0 | 0 | 0 | 0.0 | 7,312 | 26.6 | +12.1 | ||
| Independent | 0 | 0.0 | 0 | 0 | 0.0 | 140 | 0.5 | N/A | ||
| TUSC | 0 | 0.0 | 0 | 0 | 0.0 | 54 | 0.2 | New | ||
| Reform UK | 0 | 0.0 | 0 | 0 | 0.0 | 42 | 0.2 | New | ||
Ward results
Callowland
| Party | Candidate | Votes | % | ±% | |
|---|---|---|---|---|---|
| Labour | Dennis Watling | 934 | 42.2 | +4.7 | |
| Liberal Democrats | Joseph Inniss | 924 | 41.8 | -11.6 | |
| Conservative | Mary Sackett | 355 | 16.0 | +6.9 | |
| Majority | 10 | 0.4 | — | ||
| Turnout | 2,213 | 38.2 | +2.3 | ||
| Labour hold | Swing | ||||
Central
| Party | Candidate | Votes | % | ±% | |
|---|---|---|---|---|---|
| Liberal Democrats | Marilyn Devonish | 915 | 44.5 | -9.5 | |
| Labour | Sophia Demetriou-Jones | 680 | 33.1 | -3.9 | |
| Conservative | Cole Parker | 319 | 15.5 | +6.5 | |
| Independent | Dennis Wharton | 140 | 6.8 | N/A | |
| Majority | 235 | 11.4 | -5.6 | ||
| Turnout | 2,054 | 30.9 | -3.3 | ||
| Liberal Democrats hold | Swing | ||||
Holywell
| Party | Candidate | Votes | % | ±% | |
|---|---|---|---|---|---|
| Labour | Nigel Bell | 1,272 | 62.5 | +3.1 | |
| Conservative | Ian Fox | 436 | 21.4 | +9.6 | |
| Liberal Democrats | Simonie Jeffree | 274 | 13.5 | -15.4 | |
| TUSC | Mark O'Connor | 54 | 2.7 | N/A | |
| Majority | 836 | 41.1 | +10.6 | ||
| Turnout | 2,036 | 30.8 | +5.2 | ||
| Labour hold | Swing | ||||
Leggatts
| Party | Candidate | Votes | % | ±% | |
|---|---|---|---|---|---|
| Labour | Richard Smith | 819 | 37.4 | -6.2 | |
| Liberal Democrats | Shafiq Ahmed | 765 | 34.9 | +3.7 | |
| Conservative | Anthony Parker | 565 | 25.8 | +0.6 | |
| TUSC | Derek Foster | 40 | 1.8 | N/A | |
| Majority | 54 | 2.5 | -9.9 | ||
| Turnout | 2,189 | 37.9 | +3.3 | ||
| Labour hold | Swing | ||||
Meriden
| Party | Candidate | Votes | % | ±% | |
|---|---|---|---|---|---|
| Liberal Democrats | Peter Hannon | 690 | 43.0 | -16.6 | |
| Conservative | Prashanth Elangovan | 519 | 32.4 | +18.8 | |
| Labour | Felix Tyszkiewicz | 395 | 24.6 | +0.7 | |
| Majority | 171 | 10.6 | — | ||
| Turnout | 1,604 | 28.0 | -0.4 | ||
| Liberal Democrats hold | Swing | ||||
Nascot
| Party | Candidate | Votes | % | ±% | |
|---|---|---|---|---|---|
| Liberal Democrats | Mark Watkin | 1,275 | 53.9 | -10.6 | |
| Liberal Democrats | Tom Osborn | 1,179 | 49.9 | -14.6 | |
| Conservative | Binita Mehta-Parmar | 786 | 33.2 | +11.1 | |
| Conservative | Ravi Kura | 655 | 27.7 | +5.6 | |
| Labour | Sarah Flynn | 471 | 19.9 | +6.5 | |
| Labour | Edward Tunnah | 364 | 15.4 | +2.0 | |
| Turnout | — | 41.0 | +2.9 | ||
| Liberal Democrats hold | |||||
| Liberal Democrats hold | |||||
Oxhey
| Party | Candidate | Votes | % | ±% | |
|---|---|---|---|---|---|
| Liberal Democrats | Karen Clarke-Taylor | 1,316 | 60.1 | -8.4 | |
| Conservative | Joseph Gornicki | 494 | 22.5 | +8.0 | |
| Labour | Sue Sleeman | 339 | 15.5 | -1.5 | |
| Reform UK | Neal Webber | 42 | 1.9 | N/A | |
| Majority | 822 | 37.6 | -13.9 | ||
| Turnout | 2,191 | 40.8 | +3.8 | ||
| Liberal Democrats hold | Swing | ||||
Park
| Party | Candidate | Votes | % | ±% | |
|---|---|---|---|---|---|
| Liberal Democrats | Peter Jeffree | 1,472 | 52.8 | -9.6 | |
| Conservative | Linda Topping | 902 | 32.4 | +12.2 | |
| Labour | Nabila Ahmed | 412 | 14.8 | +2.1 | |
| Majority | 570 | 20.4 | -22.0 | ||
| Turnout | 2,786 | 43.4 | +1.0 | ||
| Liberal Democrats hold | Swing | ||||
Stanborough
| Party | Candidate | Votes | % | ±% | |
|---|---|---|---|---|---|
| Liberal Democrats | Simon Feldman | 956 | 49.3 | -33.9 | |
| Conservative | Peter Williams | 673 | 34.7 | N/A | |
| Labour | Nina Mileva | 312 | 16.1 | -0.7 | |
| Majority | 283 | 14.6 | -51.8 | ||
| Turnout | 1,941 | 34.1 | +3.8 | ||
| Liberal Democrats hold | Swing | ||||
Tudor
| Party | Candidate | Votes | % | ±% | |
|---|---|---|---|---|---|
| Liberal Democrats | Darren Walford | 938 | 48.6 | -12.4 | |
| Conservative | Carly Bishop | 576 | 29.8 | +11.8 | |
| Labour | Seamus Williams | 418 | 21.6 | +0.7 | |
| Majority | 362 | 18.8 | -21.3 | ||
| Turnout | 1,932 | 37.0 | +4.2 | ||
| Liberal Democrats hold | Swing | ||||
Vicarage
| Party | Candidate | Votes | % | ±% | |
|---|---|---|---|---|---|
| Labour | Sara Trebar | 1,061 | 48.1 | -9.5 | |
| Liberal Democrats | Dan Thurlow | 592 | 26.9 | -3.2 | |
| Conservative | Abbas Merali | 551 | 25.0 | +12.7 | |
| Majority | 469 | 21.2 | -6.3 | ||
| Turnout | 2,204 | 37.7 | +3.4 | ||
| Labour hold | Swing | ||||
Woodside
| Party | Candidate | Votes | % | ±% | |
|---|---|---|---|---|---|
| Liberal Democrats | Ann Saffery | 807 | 48.1 | -9.2 | |
| Conservative | Amarish Patel | 481 | 28.6 | +15.6 | |
| Labour | Malcolm Bush | 391 | 23.3 | +5.0 | |
| Majority | 326 | 19.5 | -19.5 | ||
| Turnout | 1,679 | 29.2 | +0.2 | ||
| Liberal Democrats hold | Swing | ||||
References
- ↑ Council, Watford Borough. "Elections in Watford". www.watford.gov.uk. Archived from the original on 16 May 2021. Retrieved 16 May 2021.
- ↑ Council, Watford Borough. "Elections in Watford 2021 results". www.watford.gov.uk. Archived from the original on 16 May 2021. Retrieved 16 May 2021.
This article is issued from Wikipedia. The text is licensed under Creative Commons - Attribution - Sharealike. Additional terms may apply for the media files.