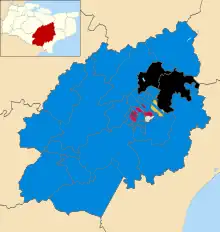
Map of results of 2015 election. Conservatives in blue, Labour in red, Liberal Democrats in orange, independents in grey, Ashford Independents in black, and UKIP in purple.
The 2015 Ashford Borough Council election took place on 7 May 2015 to elect members of Ashford Borough Council in England.[1] This was on the same day as other local elections.
Results
| Party | Seats | Gains | Losses | Net gain/loss | Seats % | Votes % | Votes | +/− | |
|---|---|---|---|---|---|---|---|---|---|
| Conservative | 34 | 4 | 0 | +4 | 79 | 52 | 38739 | ||
| Labour | 4 | 1 | 2 | -1 | 9 | 20 | 14835 | ||
| Ashford Independent | 3 | 0 | 3 | -3 | 7 | 6 | 4149 | ||
| UKIP | 1 | 1 | 0 | +1 | 2 | 10 | 7506 | ||
| Liberal Democrats | 1 | 0 | 1 | -1 | 2 | 3 | 2318 | ||
| Green | 0 | 0 | 0 | 0 | 0 | 7 | 4875 | ||
| Independent | 0 | 0 | 0 | 0 | 0 | 3 | 2175 | ||
Ward by ward
| Party | Candidate | Votes | % | ±% | |
|---|---|---|---|---|---|
| Labour | Kate Hooker | 725 | 55 | +18.7 | |
| Conservative | Paul Hardisty | 592 | 44.9 | +17.3 | |
| Majority | 133 | 10 | +9.8 | ||
| Turnout | 664 | 53.5 | +19.2 | ||
| Labour hold | Swing | ||||
| Party | Candidate | Votes | % | ±% | |
|---|---|---|---|---|---|
| Labour | Jill Britcher | 817 | 21.1 | ||
| UKIP | Beverly Joan Murphy | 812 | 20.9 | ||
| Conservative | Richard Harry Bunting | 715 | 18.4 | ||
| Labour | Dylan Alexander Jones | 452 | 16.6 | ||
| Green | Maria Ann Pizzey | 195 | 5 | ||
| Independent | Selina Kathleen Remedios | 126 | 3.2 | ||
| Conservative | Janet Elizabeth Rymer-Jones | 423 | 10.9 | ||
| Green | Aniko Szocs | 135 | 3.4 | ||
| Turnout | 3868 | 55.94 | +22.1 | ||
| Labour hold | Swing | ||||
| UKIP gain from Labour | Swing | ||||
| Party | Candidate | Votes | % | ±% | |
|---|---|---|---|---|---|
| Conservative | Neil Bell | 1057 | 72.9 | -7.5 | |
| Green | Guy Pullen | 391 | 27 | +27 | |
| Majority | 666 | 45 | -15.8 | ||
| Turnout | 1448 | 71.4 | +23.3 | ||
| Conservative hold | Swing | ||||
| Party | Candidate | Votes | % | ±% | |
|---|---|---|---|---|---|
| Labour | Kaprasad Chhantyal | 392 | 33.5 | +18.2 | |
| Conservative | Luke Powell | 778 | 66.4 | +15.7 | |
| Majority | 386 | 32.9 | +8.1 | ||
| Turnout | 1170 | 61.1 | +16.9 | ||
| Conservative hold | Swing | ||||
| Party | Candidate | Votes | % | ±% | |
|---|---|---|---|---|---|
| Conservative | Len Bunn | 465 | 29.3 | +3.9 | |
| Ashford Independent | Winston Russel Michael | 895 | 56.5 | +17.6 | |
| Liberal Democrats | Len Micklewright | 64 | 4 | -31.6 | |
| Labour | Ryan Bulley | 158 | 9.9 | +9.9 | |
| Majority | 430 | 27.1 | +23.8 | ||
| Turnout | 1582 | 65.5 | +21.6 | ||
| Ashford Independent hold | Swing | ||||
| Party | Candidate | Votes | % | ±% | |
|---|---|---|---|---|---|
| Conservative | Andrew John Buchanan | 693 | 55.7 | +18.9 | |
| Labour | Alexander Ward | 549 | 44.2 | +44.2 | |
| Majority | 144 | 11.5 | +9.3 | ||
| Turnout | 1242 | 65.2 | +23.3 | ||
| Conservative hold | Swing | ||||
| Party | Candidate | Votes | % | ±% | |
|---|---|---|---|---|---|
| UKIP | Peter Allen | 380 | 27.2 | +27.2 | |
| Conservative | Gerry Clarkson | 714 | 51.1 | -17 | |
| Liberal Democrats | Shirley Anne Davis | 303 | 21.6 | -10.3 | |
| Majority | 334 | 23.9 | -12.4 | ||
| Turnout | 1397 | 68.7 | +19.2 | ||
| Conservative hold | Swing | ||||
| Party | Candidate | Votes | % | ±% | |
|---|---|---|---|---|---|
| Conservative | Stephen Dehnel | 932 | 61.5 | +4.7 | |
| Labour | Cleo Lines | 291 | 19.2 | +19.2 | |
| Green | Marilyn Sansom | 290 | 19.1 | +3.2 | |
| Majority | 641 | 29.5 | 0 | ||
| Turnout | 1513 | 75.5 | +23 | ||
| Conservative hold | Swing | ||||
| Party | Candidate | Votes | % | ±% | |
|---|---|---|---|---|---|
| Conservative | Larry William Krause | 893 | 67.4 | +18.4 | |
| Green | Tom Medhurst | 431 | 32.5 | +20.4 | |
| Majority | 462 | 34.8 | +15.9 | ||
| Turnout | 1324 | 67.7 | +15.2 | ||
| Conservative hold | Swing | ||||
| Party | Candidate | Votes | % | ±% | |
|---|---|---|---|---|---|
| UKIP | Dave Botting | 653 | 11.1 | ||
| UKIP | Jenny Botting | 612 | 10.4 | ||
| Conservative | Peter Feacey | 1436 | 24.5 | ||
| Ashford Independent | Kenneth George Edward Frohnsdorff | 155 | 2.6 | ||
| Liberal Democrats | Adrian John Gee-Turner | 312 | 5.3 | ||
| Conservative | Bernard Heyes | 1292 | 22 | ||
| Labour | Alexander Oluwole Jaiyesimi | 570 | 9.7 | ||
| Green | Jake Adam Pentland | 334 | 5.7 | ||
| Labour | Chandrawati Rai | 490 | 8.3 | ||
| Turnout | 5854 | 65.6 | +26 | ||
| Conservative hold | Swing | ||||
| Conservative hold | Swing | ||||
| Party | Candidate | Votes | % | ±% | |
|---|---|---|---|---|---|
| Conservative | Jessamy Edmee Blanford | 782 | 43.6 | +1.4 | |
| Ashford Independent | John Hugh Durrant | 336 | 18.7 | -21.2 | |
| UKIP | Matt Peach | 358 | 19.9 | +19.9 | |
| Labour | Waheed Qureshi | 315 | 17.5 | -0.4 | |
| Majority | 424 | 23.6 | +21.3 | ||
| Turnout | 1791 | 66.5 | +28.2 | ||
| Conservative hold | Swing | ||||
| Party | Candidate | Votes | % | ±% | |
|---|---|---|---|---|---|
| Ashford Independent | Jane Davey | 391 | 29.1 | -15.3 | |
| Green | Charmaine Elizabeth Perrin | 135 | 10 | +10 | |
| Dawa Wangdi Sherpa | 221 | 16.4 | +16.4 | ||
| Conservative | Gerald White | 593 | 44.2 | +7.4 | |
| Majority | 202 | 15 | +7.3 | ||
| Turnout | 1340 | 71.4 | +26.7 | ||
| Conservative gain from Ashford Independent | |||||
| Party | Candidate | Votes | % | ±% | |
|---|---|---|---|---|---|
| Conservative | Mick Burgess | 983 | 62 | +62 | |
| Green | David Ledger | 213 | 13.4 | +13.4 | |
| UKIP | Kate Manning | 389 | 24.5 | +24.5 | |
| Majority | 594 | 37.4 | +37.4 | ||
| Turnout | 1585 | 72.3 | +72.3 | ||
| Conservative hold | Swing | ||||
| Party | Candidate | Votes | % | ±% | |
|---|---|---|---|---|---|
| Liberal Democrats | Ken Blanshard | 133 | 9.3 | +9.3 | |
| UKIP | Pat Purnell | 212 | 14.9 | +14.9 | |
| Conservative | Philip John Frederick Sims | 684 | 48.2 | +5.1 | |
| Ashford Independent | Derek William Standing | 213 | 15 | -30.7 | |
| Labour | Andrew Stevenson | 177 | 12.4 | +1.3 | |
| Majority | 471 | 33.1 | +30.5 | ||
| Turnout | 1419 | 76 | 22 | ||
| Conservative hold | Swing | ||||
| Party | Candidate | Votes | % | ±% | |
|---|---|---|---|---|---|
| UKIP | Bev Gregory | 321 | 21 | +21 | |
| Liberal Democrats | Clare Hardwick | 128 | 8.3 | -11 | |
| Conservative | Marion Martin | 747 | 48.9 | -1.1 | |
| Labour | Grace Emily O'Driscoll | 331 | 21.6 | +7.9 | |
| Majority | 416 | 27.2 | -3.5 | ||
| Turnout | 1419 | 69 | +22.8 | ||
| Conservative hold | Swing | ||||
| Party | Candidate | Votes | % | ±% | |
|---|---|---|---|---|---|
| Labour | Gordon Miller | 506 | 44 | +13.5 | |
| Conservative | Jenny Webb | 643 | 55.9 | +28.4 | |
| Majority | 137 | 11.9 | +8.9 | ||
| Turnout | 1149 | 57.7 | +20.4 | ||
| Conservative gain from Labour | Swing | ||||
| Party | Candidate | Votes | % | ±% | |
|---|---|---|---|---|---|
| Conservative | Jeremy Paul Adby | 1019 | 22.5 | ||
| Green | Steve Robert Campkin | 406 | 8.9 | ||
| Liberal Democrats | George Koowaree | 1147 | 25.4 | ||
| Labour | Dhan Ragu | 565 | 12.5 | ||
| Independent | Andrew Martin William Mortimer | 436 | 9.6 | ||
| Labour | Elizabeth Mylonogianni | 623 | 13.8 | ||
| Conservative | Ian Andrew Price | 317 | 7 | ||
| Turnout | 4513 | 68.6 | +21.9 | ||
| Liberal Democrats hold | Swing | ||||
| Conservative gain from Ashford Independent | |||||
| Party | Candidate | Votes | % | ±% | |
|---|---|---|---|---|---|
| Labour | Sean Davidson | 328 | 19.5 | -2.1 | |
| Conservative | Tina Heyes | 821 | 48.8 | -5.6 | |
| Independent | John Holland | 193 | 11.4 | +11.4 | |
| UKIP | Jim Lucy | 337 | 20 | +20 | |
| Majority | 484 | 28.8 | -4.1 | ||
| Turnout | 1679 | 67 | +26 | ||
| Conservative hold | Swing | ||||
| Party | Candidate | Votes | % | ±% | |
|---|---|---|---|---|---|
| Labour | Amy Mitchell | 436 | 34.1 | +7.5 | |
| Conservative | Jim Wedgbury | 839 | 65.8 | -7.6 | |
| Majority | 403 | 31.6 | -15.2 | ||
| Turnout | 1275 | 61.7 | +29.2 | ||
| Conservative hold | Swing | ||||
| Party | Candidate | Votes | % | ±% | |
|---|---|---|---|---|---|
| Conservative | Mike Bennett | Uncontested | N/A | 0 | |
| Conservative hold | Swing | ||||
| Party | Candidate | Votes | % | ±% | |
|---|---|---|---|---|---|
| Labour | Giri Arulampalam | 453 | 8.3 | ||
| Ashford Independent | Sue Davison | 645 | 11.9 | ||
| Conservative | William Thomas Howard | 2000 | 36.9 | ||
| Conservative | Jane Martin | 1832 | 33.8 | ||
| Labour | Rebecca Rutter | 479 | 8.8 | ||
| Turnout | 5418 | 75.79 | 23 | ||
| Conservative hold | Swing | ||||
| Conservative hold | Swing | ||||
| Party | Candidate | Votes | % | ±% | |
|---|---|---|---|---|---|
| Conservative | William Barrett | 646 | 42.9 | -3.8 | |
| Ashford Independent | Sarah Angela Heaton Dacre | 226 | 15 | -0.2 | |
| Labour | Sally Ann Gathern | 331 | 22 | +22 | |
| UKIP | Mike Withycombe | 300 | 19.9 | +19.9 | |
| Majority | 315 | 20.9 | +2.9 | ||
| Turnout | 1503 | 63.2 | +25.7 | ||
| Conservative hold | Swing | ||||
| Party | Candidate | Votes | % | ±% | |
|---|---|---|---|---|---|
| Green | Joanna Baker | 96 | 6.5 | +6.5 | |
| Labour | Martin Chandler | 303 | 20.5 | +2.3 | |
| Conservative | Sara-Jane Martin | 297 | 20.1 | +2.1 | |
| Independent | David Owen Smith | 520 | 35.2 | -28.6 | |
| UKIP | Mike Sykes | 248 | 16.8 | +16.8 | |
| Majority | 217 | 14.7 | -30.9 | ||
| Turnout | 1474 | 57.2 | +11.6 | ||
| Independent hold | Swing | ||||
| Party | Candidate | Votes | % | ±% | |
|---|---|---|---|---|---|
| Conservative | John Link | 893 | 75.5 | +4.4 | |
| Green | Matthew Stanley | 291 | 24.6 | +3.4 | |
| Majority | 600 | 50.7 | +1 | ||
| Turnout | 1182 | 63.8 | +16.9 | ||
| Conservative hold | Swing | ||||
| Party | Candidate | Votes | % | ±% | |
|---|---|---|---|---|---|
| UKIP | Eddy Barrows | 245 | 25.2 | +25.2 | |
| Labour | Brendan Chilton | 482 | 49.6 | -3.9 | |
| Conservative | James Charles King | 185 | 19 | +19 | |
| Green | Thom Pizzey | 59 | 6 | +6 | |
| Majority | 337 | 34.7 | +22.3 | ||
| Turnout | 971 | 45.6 | +17.1 | ||
| Labour hold | Swing | ||||
| Party | Candidate | Votes | % | ±% | |
|---|---|---|---|---|---|
| Labour | Euan Fergus Anckorn | 739 | 18.6 | ||
| Conservative | Graham Galpin | 1298 | 32.6 | ||
| Green | Peter David Morgan | 478 | 12 | ||
| Labour | Charles Suddards | 594 | 14.9 | ||
| Conservative | Chris Waters | 863 | 14.9 | ||
| Turnout | 3972 | 63.7 | +22.3 | ||
| Conservative hold | Swing | ||||
| Conservative hold | Swing | ||||
| Party | Candidate | Votes | % | ±% | |
|---|---|---|---|---|---|
| Liberal Democrats | Steve Bowen | 160 | 11.2 | +11.2 | |
| Conservative | Paul Clokie | 827 | 58.1 | +8 | |
| Ashford Independent | Roy Anthony Isworth | 248 | 17.4 | +17.4 | |
| Labour | David Joh Ward | 186 | 13 | +1.1 | |
| Majority | 579 | 40.7 | +14.6 | ||
| Turnout | 1421 | 77.4 | +65.5 | ||
| Conservative hold | Swing | ||||
| Party | Candidate | Votes | % | ±% | |
|---|---|---|---|---|---|
| UKIP | Lynn Brodlie | 270 | 19.3 | +19.3 | |
| Labour | Demi Chilton | 179 | 12.8 | +12.8 | |
| Conservative | Callum Knowles | 946 | 67.8 | +9 | |
| Majority | 676 | 48.4 | +31.1 | ||
| Turnout | 1359 | 70.9 | +22.3 | ||
| Conservative hold | Swing | ||||
| Party | Candidate | Votes | % | ±% | |
|---|---|---|---|---|---|
| Conservative | Harold Apps | 674 | 16.7 | ||
| UKIP | Neil Burgess | 640 | 15.8 | ||
| UKIP | Elaine Evans | 479 | 11.8 | ||
| Labour | Dara Farrell | 721 | 17.8 | ||
| Labour | Caroline Jean Harris | 636 | 15.7 | ||
| Conservative | Shafi Khan | 549 | 13.6 | ||
| Green | Claire Madeleine | 332 | 8.2 | ||
| Turnout | 4031 | 57.1 | +20.2 | ||
| Labour gain from Liberal Democrats | Swing | ||||
| Conservative hold | Swing | ||||
| Party | Candidate | Votes | % | ±% | |
|---|---|---|---|---|---|
| Ashford Independent | Tony Francis | 389 | 25.2 | +12.9 | |
| Labour | Sue Riley-Nevers | 379 | 24.6 | +3.5 | |
| Conservative | Neil James Shorter | 772 | 50.1 | +12.4 | |
| Majority | 383 | 40.7 | +32 | ||
| Turnout | 1540 | 62.1 | +25.8 | ||
| Conservative hold | Swing | ||||
| Party | Candidate | Votes | % | ±% | |
|---|---|---|---|---|---|
| Conservative | Clair Louise Bell | 1660 | 33 | ||
| Independent | Keith William Brannan | 679 | 13.5 | ||
| Labour | Dion Chilton | 288 | 5.7 | ||
| Labour | June Graham | 264 | 5.2 | ||
| UKIP | Martin Oldaker | 791 | 15.7 | ||
| Conservative | Alan Michael Pickering | 1347 | 26.7 | ||
| Turnout | 5029 | 72.22 | |||
| Conservative hold | Swing | ||||
| Conservative hold | Swing | ||||
| Party | Candidate | Votes | % | ±% | |
|---|---|---|---|---|---|
| Conservative | Paul William Bartlett | 1140 | 74.6 | ||
| Green | Geoff Meaden | 388 | 25.3 | ||
| Majority | 752 | 49.2 | |||
| Turnout | 1528 | 70.6 | |||
| Conservative hold | Swing | ||||
| Party | Candidate | Votes | % | ±% | |
|---|---|---|---|---|---|
| Conservative | Geraldine Averil Dyer | 968 | 65.7 | ||
| UKIP | Mark H D Hudson | 333 | 22.2 | ||
| Green | Hilary Jones | 194 | 12.9 | ||
| Majority | 1162 | 77.7 | |||
| Turnout | 1495 | 76.6 | |||
| Conservative hold | Swing | ||||
| Party | Candidate | Votes | % | ±% | |
|---|---|---|---|---|---|
| Conservative | Brad Bradford | 1969 | 36 | ||
| Conservative | Aline Kathleen Hicks | 2053 | 37.5 | ||
| Labour | Viven Wheatley | 587 | 10.7 | ||
| Green | Liz Wright | 507 | 9.2 | ||
| Labour | Arthur Young | 347 | 6.3 | ||
| Turnout | 5463 | 73.47 | |||
| Conservative gain from Ashford Independent | |||||
| Conservative hold | Swing | ||||
| Party | Candidate | Votes | % | ±% | |
|---|---|---|---|---|---|
| Labour | Jayne Chilton | 142 | 10.2 | ||
| Liberal Democrats | Stuart James Dove | 71 | 5.1 | ||
| Conservative | Alex Howard | 402 | 28.8 | ||
| UKIP | Alan William Edward Newill | 126 | 9 | ||
| Ashford Independents | Noel Ovenden | 651 | 46.7 | ||
| Majority | 249 | 17.8 | |||
| Turnout | 1392 | 74.9 | |||
| Ashford Independent hold | Swing | ||||
References
- ↑ "Upcoming elections & referendums". The Electoral Commission. Archived from the original on 15 March 2015. Retrieved 5 April 2015.
- 1 2 3 4 5 6 7 8 9 10 11 12 13 14 15 16 17 18 19 20 21 22 23 24 25 26 27 28 29 30 31 32 33 34 35 "Parliamentary, Borough and Parish Council Election Results 2015". Ashford.gov.uk. Retrieved 13 May 2015.
| Kent County Council | |
|---|---|
| Ashford Borough Council | |
| Canterbury City Council | |
| Dartford Borough Council | |
| Dover District Council | |
| Folkestone & Hythe District Council | |
| Gravesham Borough Council | |
| Maidstone Borough Council | |
| Medway Council | |
| Sevenoaks District Council | |
| Swale Borough Council | |
| Thanet District Council | |
| Tonbridge & Malling Borough Council | |
| Tunbridge Wells Borough Council | |
| Rochester-upon-Medway City Council |
|
| Gillingham Borough Council |
|
| |
This article is issued from Wikipedia. The text is licensed under Creative Commons - Attribution - Sharealike. Additional terms may apply for the media files.