| |||||||||||||||||||||||||||||
15 of the 39 seats to Stevenage Borough Council 20 seats needed for a majority | |||||||||||||||||||||||||||||
|---|---|---|---|---|---|---|---|---|---|---|---|---|---|---|---|---|---|---|---|---|---|---|---|---|---|---|---|---|---|
| Turnout | 28.1% | ||||||||||||||||||||||||||||
| |||||||||||||||||||||||||||||
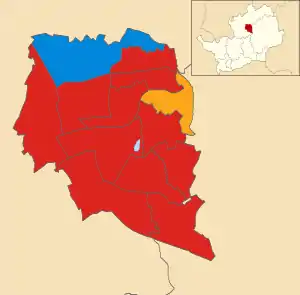 Map showing the results of contested wards in the 2000 Stevenage Borough Council elections. | |||||||||||||||||||||||||||||
| |||||||||||||||||||||||||||||
Elections to Stevenage Council in Hertfordshire, England were held on 4 May 2000. One third of the council was up for election; the seats of the candidates who finished third in each ward in the all-out election of 1999. The Labour Party stayed in overall control of the council, which it had held continuously since its creation in 1973.
After the election, the composition of the council was:[1]
- Labour 33
- Liberal Democrat 3
- Conservative 3
Election result
| Party | Seats | Gains | Losses | Net gain/loss | Seats % | Votes % | Votes | +/− | |
|---|---|---|---|---|---|---|---|---|---|
| Labour | 13 | 0 | 86.7 | ||||||
| Liberal Democrats | 1 | 0 | 6.7 | ||||||
| Conservative | 1 | 0 | 6.7 | ||||||
Ward results
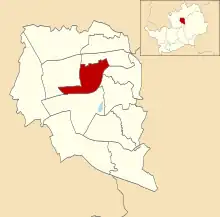
Bandley Hill
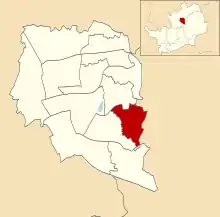
Location of Bandley Hill ward
| Party | Candidate | Votes | % | |
|---|---|---|---|---|
| Labour | Lilian Strange[2] | 631 | 61.7 | |
| Conservative | F. Warner | 244 | 23.9 | |
| Liberal Democrats | M. Latham | 144 | 11.2 | |
| Socialist Alternative | M. Pickersgill | 33 | 3.2 | |
| Majority | 37.8 | |||
| Turnout | 20.7 | |||
Bedwell
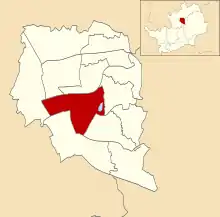
Location of Bedwell ward
| Party | Candidate | Votes | % | |
|---|---|---|---|---|
| Labour | David Cullen[2] | 1,122 | 63.0 | |
| Conservative | M. Wyatt | 376 | 21.1 | |
| Liberal Democrats | G. Robbins | 282 | 15.8 | |
| Majority | 41.9 | |||
| Turnout | 38.1 | |||
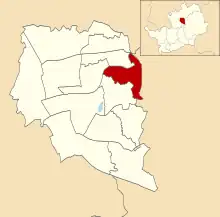
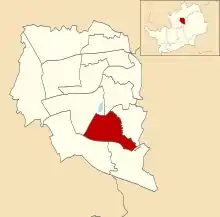
Chells

Location of Chells ward
| Party | Candidate | Votes | % | |
|---|---|---|---|---|
| Labour | Jeannette Thomas[2] | 572 | 43.5 | |
| Liberal Democrats | Mary Griffith | 572 | 43.5 | |
| Conservative | W. Clark | 172 | 13.1 | |
| Majority | 0 | 0.0 | ||
| Turnout | 28.3 | |||
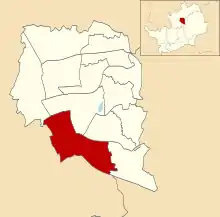
Longmeadow

Location of Longmeadow ward
| Party | Candidate | Votes | % | |
|---|---|---|---|---|
| Labour | Bruce Jackson[2] | 541 | 48.3 | |
| Conservative | V. Ovenden | 376 | 33.6 | |
| Liberal Democrats | D. Wilkins | 156 | 13.9 | |
| Green | Hoyes W. | 46 | 4.1 | |
| Majority | 14.7 | |||
| Turnout | 24.9 | |||
Manor
Location of Manor ward
| Party | Candidate | Votes | % | |
|---|---|---|---|---|
| Liberal Democrats | Graham Snell[2] | 875 | 60.4 | |
| Labour | F. Price | 325 | 22.4 | |
| Conservative | S. Smith | 249 | 17.2 | |
| Majority | 38.0 | |||
| Turnout | 30.8 | |||
Martins Wood

Location of Martins Wood ward
| Party | Candidate | Votes | % | |
|---|---|---|---|---|
| Labour | David Royall[2] | 514 | 48.3 | |
| Conservative | M. Hurst | 340 | 32.0 | |
| Liberal Democrats | L. Lambert | 129 | 12.1 | |
| Green | I. Murrill | 81 | 7.6 | |
| Majority | 174 | 16.3 | ||
| Turnout | 22.7 | |||
Old Town

Location of Old Town ward
| Party | Candidate | Votes | % | |
|---|---|---|---|---|
| Labour | Hugh Tessier[2] | 1,035 | 45.4 | |
| Conservative | S. Greaves | 966 | 42.3 | |
| Liberal Democrats | Jennifer Moorcroft | 280 | 12.3 | |
| Majority | 69 | 3.1 | ||
| Turnout | 49.2 | |||
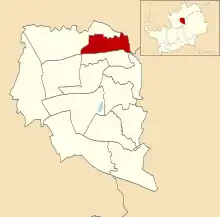
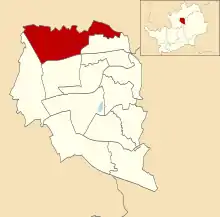
Pin Green
Location of Pin Green ward
| Party | Candidate | Votes | % | |
|---|---|---|---|---|
| Labour | Simon Speller[2] | 644 | 59.5 | |
| Conservative | L. Notley | 302 | 27.9 | |
| Liberal Democrats | H. Snell | 137 | 12.7 | |
| Majority | 31.6 | |||
| Turnout | 23.6 | |||
Roebuck
Location of Roebuck ward
| Party | Candidate | Votes | % | |
|---|---|---|---|---|
| Labour | Brian Dunnell[2] | 541 | 48.8 | |
| Conservative | P. Wilkins | 319 | 28.8 | |
| Liberal Democrats | J. Bellars | 249 | 22.5 | |
| Majority | 20.0 | |||
| Turnout | 24.0 | |||
St Nicholas
Location of St Nicholas ward
| Party | Candidate | Votes | % | |
|---|---|---|---|---|
| Labour | Richard Henry[2] | 524 | ||
| Labour | C. Latif | 514 | ||
| Conservative | L. Clark | 308 | ||
| Conservative | S. Woods | 295 | ||
| Liberal Democrats | K. Lloyd | 184 | ||
| Majority | 21.3 | |||
| Turnout | 21.2 | |||
Shephall
Location of Shephall ward
| Party | Candidate | Votes | % | |
|---|---|---|---|---|
| Labour | David Webb[2] | 818 | ||
| Labour | Brian Hall[2] | 780 | ||
| Conservative | V. Greaves | 192 | ||
| Conservative | S. Kerby | 180 | ||
| Liberal Democrats | Nicholas Baskerville | 153 | ||
| Liberal Democrats | G. Knight | 152 | ||
| Green | T. Figg | 28 | ||
| Majority | 52.6 | |||
| Turnout | 26.3 | |||
Symonds Green
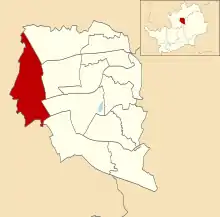
Location of Symonds Green ward
| Party | Candidate | Votes | % | |
|---|---|---|---|---|
| Labour | Tony Turner[2] | 624 | 54.5 | |
| Conservative | D. Clark | 415 | 36.3 | |
| Liberal Democrats | S. Grubert | 105 | 9.2 | |
| Majority | 209 | 18.2 | ||
| Turnout | 24.9 | |||
Woodfield
Location of Woodfield ward
| Party | Candidate | Votes | % | |
|---|---|---|---|---|
| Conservative | Margaret Notley[2] | 591 | 58.2 | |
| Labour | A. Ismail | 354 | 34.9 | |
| Liberal Democrats | E. Sturges | 70 | 6.9 | |
| Majority | 237 | 23.3 | ||
| Turnout | 31.2 | |||
References
- ↑ "Local Elections 2000 Stevenage". BBC News. Retrieved 12 May 2019.
- 1 2 3 4 5 6 7 8 9 10 11 12 13 14 "Stevenage Council Wards Members of the Council". Stevenage Borough Council. Archived from the original on 8 November 2002. Retrieved 12 July 2019.
This article is issued from Wikipedia. The text is licensed under Creative Commons - Attribution - Sharealike. Additional terms may apply for the media files.