| |||||||||||||||||||||||||
All 60 seats in the Plymouth City Council 31 seats needed for a majority | |||||||||||||||||||||||||
|---|---|---|---|---|---|---|---|---|---|---|---|---|---|---|---|---|---|---|---|---|---|---|---|---|---|
| |||||||||||||||||||||||||
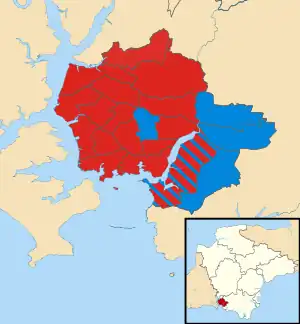 Map showing the results of the 1997 Plymouth City Council elections. | |||||||||||||||||||||||||
| |||||||||||||||||||||||||
The 1997 Plymouth City Council election took place on 1 May 1997 to elect members of Plymouth City Council in Devon, England. This was on the same day as other local elections. The Labour Party retained control of the council, which it had held since 1991.[1]
Overall results
| Party | Seats | Gains | Losses | Net gain/loss | Seats % | Votes % | Votes | +/− | |
|---|---|---|---|---|---|---|---|---|---|
| Labour | 47 | 1 | 8 | 78.3 | 47.2 | 62,966 | |||
| Conservative | 13 | 8 | 1 | 21.7 | 32.8 | 43,731 | |||
| Liberal Democrats | 0 | 0 | 0 | 0.0 | 17.3 | 23,146 | |||
| Independent | 0 | 0 | 0 | 0.0 | 1.1 | 1,405 | |||
| Green | 0 | 0 | 0 | 0.0 | 0.8 | 1,030 | |||
| Independent Democrat | 0 | 0 | 0 | 0.0 | 0.7 | 999 | New | ||
| UKIP | 0 | 0 | 0 | 0.0 | 0.2 | 244 | |||
| Total | 60 | 133,521 | |||||||
Ward results
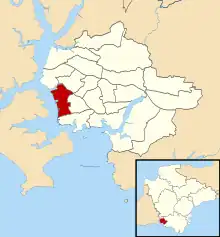
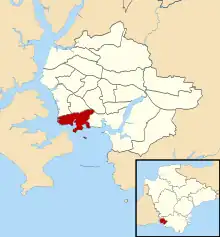
Budshead (3 seats)
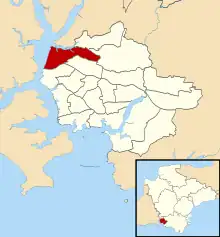
Location of Budshead ward
| Party | Candidate | Votes | % | |
|---|---|---|---|---|
| Labour | Ronald Sydney Simmonds | 3,997 | ||
| Labour | Paul Carter | 3,746 | ||
| Labour | Thomas Barry Coleman | 3,474 | ||
| Liberal Democrats | S. Hutty | 1,203 | ||
| Conservative | K. Watkin | 1,168 | ||
| Liberal Democrats | M. Trench | 1,058 | ||
| Turnout | 65.0% | |||
| Labour hold | ||||
| Labour hold | ||||
| Labour hold | ||||
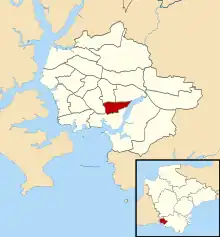
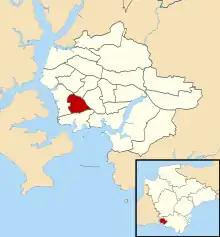
Compton (3 seats)
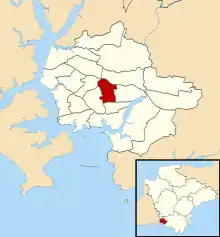
Location of Compton ward
| Party | Candidate | Votes | % | |
|---|---|---|---|---|
| Conservative | Albert Fry | 3,402 | ||
| Conservative | Thomas Edward James Savery | 3,362 | ||
| Conservative | David John Stark | 3,221 | ||
| Labour | K. French | 1,677 | ||
| Labour | L. Harris | 1,674 | ||
| Labour | I. Tuffin | 1,526 | ||
| Liberal Democrats | R. Casley | 1,390 | ||
| Liberal Democrats | J. Rushton | 1,307 | ||
| Liberal Democrats | D. Van Eetvelt | 1,063 | ||
| Green | F. Allen | 502 | ||
| Turnout | 67.4% | |||
| Conservative hold | ||||
| Conservative hold | ||||
| Conservative hold | ||||
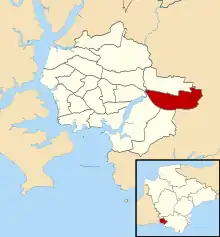
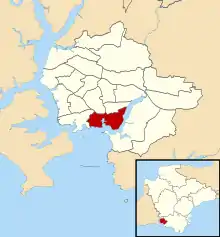
Drake (3 seats)
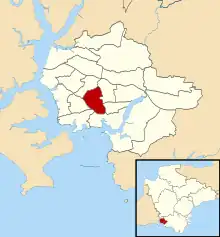
Location of Drake ward
| Party | Candidate | Votes | % | |
|---|---|---|---|---|
| Labour | Christopher Peter Burgess | 2,376 | ||
| Labour | Ernest Alexander Colley | 2,340 | ||
| Labour | Pauline Mary Purnell | 2,245 | ||
| Liberal Democrats | G. Nye | 2,031 | ||
| Liberal Democrats | B. Yardley | 1,962 | ||
| Conservative | P. Parnall | 1,917 | ||
| Conservative | W. Hodges | 1,881 | ||
| Liberal Democrats | P. York | 1,842 | ||
| Conservative | M. White | 1,824 | ||
| Green | G. Grindrod | 528 | ||
| Turnout | 60.8% | |||
| Labour hold | ||||
| Labour hold | ||||
| Labour hold | ||||
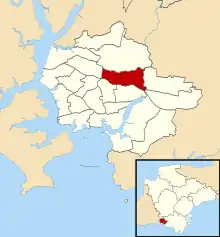
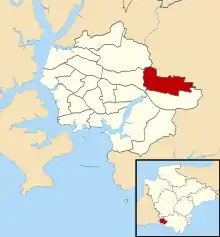
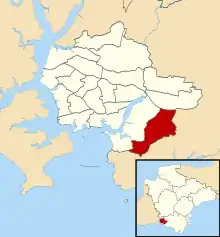
Efford (3 seats)

Location of Efford ward
| Party | Candidate | Votes | % | |
|---|---|---|---|---|
| Labour | Bernard Claude Alexander Miller | 3,404 | ||
| Labour | Jane Margaret Jones | 3,314 | ||
| Labour | Bernard Claude Alexander Vincent | 3,161 | ||
| Conservative | K. Banks | 1,671 | ||
| Conservative | M. Leaves | 1,550 | ||
| Conservative | M. Orchard | 1,524 | ||
| Liberal Democrats | R. Bray | 982 | ||
| Liberal Democrats | D. Taylor | 941 | ||
| Liberal Democrats | R. Vosper | 911 | ||
| Turnout | 68.6% | |||
| Labour hold | ||||
| Labour hold | ||||
| Labour hold | ||||
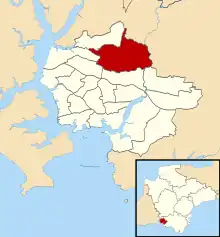
Eggbuckland (3 seats)
Location of Eggbuckland ward
| Party | Candidate | Votes | % | |
|---|---|---|---|---|
| Labour | Derick Brian Bray | 4,034 | ||
| Labour | Michael George Wright | 3,787 | ||
| Labour | Robert Anthony Gachagan | 3,527 | ||
| Conservative | G. Bragg | 2,633 | ||
| Conservative | M. Foster | 2,372 | ||
| Conservative | J. Wallace | 2,365 | ||
| Liberal Democrats | A. Nelmes | 1,627 | ||
| Turnout | 72.7% | |||
| Labour hold | ||||
| Labour hold | ||||
| Labour hold | ||||
Estover (3 seats)
Location of Estover ward
| Party | Candidate | Votes | % | |
|---|---|---|---|---|
| Labour | Michael Robert Fox | 3,937 | ||
| Labour | Charles Joseph William Demuth | 3,736 | ||
| Labour | Valentine Hiromeris | 3,269 | ||
| Conservative | P. Brookshaw | 3,184 | ||
| Conservative | M. Gibson | 3,146 | ||
| Conservative | B. Brookshaw | 3,139 | ||
| Liberal Democrats | T. Wickett | 1,634 | ||
| Turnout | 68.3% | |||
| Labour hold | ||||
| Labour hold | ||||
| Labour hold | ||||
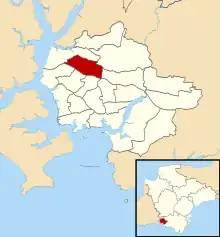
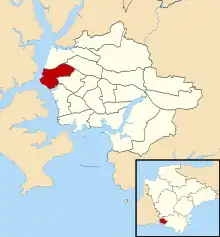
Ham (3 seats)
Location of Ham ward
| Party | Candidate | Votes | % | |
|---|---|---|---|---|
| Labour | Frederick James Ball | 3,533 | ||
| Labour | Tudor Evans | 3,143 | ||
| Labour | D. Knott | 2,911 | ||
| Conservative | G. Monahan | 1,288 | ||
| Independent Democrat | P. Stanner | 999 | ||
| Turnout | 65.5% | |||
| Labour hold | ||||
| Labour hold | ||||
| Labour hold | ||||
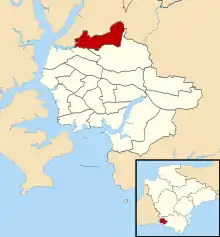
Honicknowle (3 seats)
Location of Honicknowle ward
| Party | Candidate | Votes | % | |
|---|---|---|---|---|
| Labour | John Joseph Ingham | 4,639 | ||
| Labour | Alan George Ford | 4,135 | ||
| Labour | A. Bennett | 3,976 | ||
| Conservative | R. Mahony | 1,765 | ||
| Turnout | 67.6% | |||
| Labour hold | ||||
| Labour hold | ||||
| Labour hold | ||||
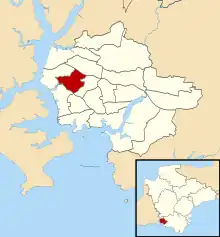
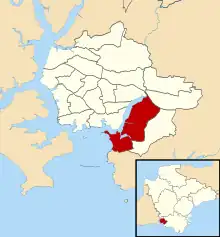
Keyham (3 seats)
Location of Keyham ward
| Party | Candidate | Votes | % | |
|---|---|---|---|---|
| Labour | Michael John Sheaff | 3,100 | ||
| Labour | Alan Stephens | 2,704 | ||
| Labour | Steven Paul Lemin | 2,152 | ||
| Conservative | J. Johnson | 1,471 | ||
| Conservative | S. Wheeler | 1,331 | ||
| Liberal Democrats | M. Gallagher | 1,213 | ||
| Conservative | D. McKechnie | 1,171 | ||
| Turnout | 61.4% | |||
| Labour hold | ||||
| Labour hold | ||||
| Labour hold | ||||
Mount Gould (3 seats)
Location of Mount Gould ward
| Party | Candidate | Votes | % | |
|---|---|---|---|---|
| Labour | Patrica Nora Coyle | 2,410 | ||
| Labour | Edwin Shaun Rennie | 2,251 | ||
| Labour | John Gerard Williams | 2,249 | ||
| Conservative | C. Atkey | 1,447 | ||
| Conservative | M. Campbell | 1,440 | ||
| Conservative | M. Turner | 1,283 | ||
| Liberal Democrats | N. Black | 1,119 | ||
| Liberal Democrats | C. Summerfield | 1,116 | ||
| Liberal Democrats | H. Biles | 1,078 | ||
| Independent | C. Brown | 450 | ||
| Independent | S. Mitchell | 335 | ||
| Independent | M. Roberts | 286 | ||
| Turnout | 61.8% | |||
| Labour hold | ||||
| Labour hold | ||||
| Labour hold | ||||
Plympton Erle (3 seats)
Location of Plympton Erle ward
| Party | Candidate | Votes | % | |
|---|---|---|---|---|
| Conservative | Kathleen Lucy Banks | 3,627 | ||
| Conservative | John Frederick Fox | 3,473 | ||
| Conservative | David John James | 3,379 | ||
| Labour | R. Rogers | 3,262 | ||
| Labour | K. Hill | 2,992 | ||
| Labour | I. Gordon | 2,962 | ||
| Liberal Democrats | K. Hill | 2,725 | ||
| Liberal Democrats | M. Neale | 2,448 | ||
| Turnout | 70.0% | |||
| Conservative gain from Labour | ||||
| Conservative gain from Labour | ||||
| Conservative gain from Labour | ||||
Plympton St Mary (3 seats)
Location of Plympton St Mary ward
| Party | Candidate | Votes | % | |
|---|---|---|---|---|
| Conservative | Joan Iris Stopporton | 3,510 | ||
| Conservative | Patrick Nicholson | 3,321 | ||
| Conservative | Maureen Lawley | 3,294 | ||
| Labour | P. Smith | 2,613 | ||
| Labour | A. Wellington | 2,313 | ||
| Labour | G. Shears | 2,303 | ||
| Liberal Democrats | D. Tyrie | 1,711 | ||
| Turnout | 73.7% | |||
| Conservative gain from Labour | ||||
| Conservative gain from Labour | ||||
| Conservative hold | ||||
Plymstock Dunstone (3 seats)
Location of Plymstock Dunstone ward
| Party | Candidate | Votes | % | |
|---|---|---|---|---|
| Conservative | David Frank Viney | 3,687 | ||
| Conservative | Vivien Anne Pengelly | 3,360 | ||
| Conservative | Kevin Charles Wigens | 3,174 | ||
| Labour | J. Kirk | 2,493 | ||
| Labour | R. Evans | 2,411 | ||
| Labour | E. Cohen | 2,217 | ||
| Liberal Democrats | S. Byatt | 1,796 | ||
| Liberal Democrats | J. Coker | 1,689 | ||
| Liberal Democrats | M. Coker | 1,571 | ||
| Turnout | 72.4% | |||
| Conservative hold | ||||
| Conservative gain from Labour | ||||
| Conservative gain from Labour | ||||
Plymstock Radford (3 seats)
Location of Plymstock Radford ward
| Party | Candidate | Votes | % | |
|---|---|---|---|---|
| Labour | Ruth Earl | 2,496 | ||
| Conservative | Kenneth James Foster | 2,288 | ||
| Labour | Peter Francis Allan | 2,284 | ||
| Conservative | A. Lugger | 2,207 | ||
| Labour | S. Polkinghorn | 2,035 | ||
| Conservative | M. Leaves | 2,016 | ||
| Liberal Democrats | C. Burrows | 1,407 | ||
| Liberal Democrats | J. Tisdall | 1,333 | ||
| Liberal Democrats | J. Byatt | 1,184 | ||
| UKIP | R. Bullock | 244 | ||
| Turnout | 72.4% | |||
| Labour hold | ||||
| Conservative gain from Labour | ||||
| Labour hold | ||||
Southway (3 seats)
Location of Southway ward
| Party | Candidate | Votes | % | |
|---|---|---|---|---|
| Labour | Dennis John Camp | 4,204 | ||
| Labour | Eileen Ruby Evans | 4,102 | ||
| Labour | John George Jones | 4,036 | ||
| Conservative | J. Harden | 2,143 | ||
| Conservative | E. Willey | 2,002 | ||
| Conservative | G. Horler | 1,980 | ||
| Turnout | 67.7% | |||
| Labour hold | ||||
| Labour hold | ||||
| Labour hold | ||||
St Budeax (3 seats)
Location of St Budeax ward
| Party | Candidate | Votes | % | |
|---|---|---|---|---|
| Labour | John Ambrose Coyle | 3,619 | ||
| Labour | Debre Ann Roche | 3,424 | ||
| Labour | Thomas Trerise Wildy | 3,075 | ||
| Conservative | J. Plymsol | 2,145 | ||
| Turnout | 64.0% | |||
| Labour hold | ||||
| Labour hold | ||||
| Labour hold | ||||
St Peter (3 seats)
Location of St Peter ward
| Party | Candidate | Votes | % | |
|---|---|---|---|---|
| Labour | Sylvia Yvonne Bellamy | 2,918 | ||
| Labour | Mark Anthony King | 2,521 | ||
| Labour | Ashley Telford Mason | 2,338 | ||
| Liberal Democrats | R. Egerton | 968 | ||
| Conservative | D. Gamble | 964 | ||
| Conservative | J. Parry | 949 | ||
| Conservative | J. Paton | 879 | ||
| Liberal Democrats | P. Jones | 859 | ||
| Liberal Democrats | H. Guy | 858 | ||
| Independent | D. Kelway | 271 | ||
| Independent | M. Howes | 186 | ||
| Independent | T. Russell | 181 | ||
| Turnout | 55.6% | |||
| Labour hold | ||||
| Labour hold | ||||
| Labour hold | ||||
Stoke (3 seats)
Location of Stoke ward
| Party | Candidate | Votes | % | |
|---|---|---|---|---|
| Labour | David Alexander Millar | 2,961 | ||
| Labour | Janet Millar | 2,831 | ||
| Labour | William John Stevens | 2,577 | ||
| Conservative | C. Pascoe | 1,993 | ||
| Conservative | B. Pascoe | 1,990 | ||
| Conservative | B. Fox | 1,976 | ||
| Liberal Democrats | J. Evans | 1,277 | ||
| Liberal Democrats | S. Guy | 1,258 | ||
| Liberal Democrats | M. Hazell | 1,174 | ||
| Turnout | 63.2% | |||
| Labour hold | ||||
| Labour hold | ||||
| Labour hold | ||||
Sutton (3 seats)
Location of Sutton ward
| Party | Candidate | Votes | % | |
|---|---|---|---|---|
| Labour | Christopher Mavin | 2,602 | ||
| Labour | Jean Nelder | 2,592 | ||
| Labour | George Wheeler | 2,403 | ||
| Conservative | F. Brimacombe | 1,397 | ||
| Conservative | D. Brimacombe | 1,291 | ||
| Conservative | R. Garley | 1,139 | ||
| Liberal Democrats | J. Dean | 895 | ||
| Liberal Democrats | M. Flippance | 789 | ||
| Liberal Democrats | T. Longworth | 784 | ||
| Independent | K. Kelway | 684 | ||
| Independent | G. Fletcher | 419 | ||
| Independent | J. Preece | 359 | ||
| Turnout | 61.4% | |||
| Labour hold | ||||
| Labour hold | ||||
| Labour hold | ||||
Trelawny (3 seats)

Location of Trelawny ward
| Party | Candidate | Votes | % | |
|---|---|---|---|---|
| Labour | Howard Leslie Davey | 2,691 | ||
| Labour | David Martin Palmer | 2,645 | ||
| Labour | Thelma Hilda Irene Rider | 2,608 | ||
| Conservative | P. Nicholson | 2,031 | ||
| Conservative | D. Kaye | 2,007 | ||
| Conservative | R. Lloyd | 1,897 | ||
| Liberal Democrats | K. D'Arcy | 901 | ||
| Liberal Democrats | A. Robins | 878 | ||
| Liberal Democrats | S. Simmonds | 776 | ||
| Turnout | 73.7% | |||
| Labour hold | ||||
| Labour hold | ||||
| Labour gain from Conservative | ||||
References
- 1 2 Rallings, Colin; Thrasher, Michael. Local Elections Handbook 1997 (PDF). Plymouth University, Plymouth, UK: The Elections Centre. p. 9.
- ↑ "Plymouth City Council - Member Profiles". Archived from the original on 29 January 1997. Retrieved 19 November 2019.
- ↑ "Plymouth City Council Election Results 1997-2012" (PDF). Elections Centre. Retrieved 21 November 2019.
| County councils |
|
|---|---|
| Unitary authorities |
|
| District councils (England) |
|
| District councils (Northern Ireland) | |
| Sui generis |
|
| Referendums | |
| |
This article is issued from Wikipedia. The text is licensed under Creative Commons - Attribution - Sharealike. Additional terms may apply for the media files.