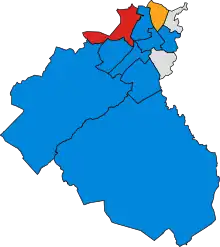
Results by ward.
Elections for the Eastwood District Council took place on Thursday 5 May 1988, alongside elections to the councils of Scotland's various other districts.
The Conservatives continued their dominance of the council, winning 49% of the vote and two thirds of the Districts seats.[1]
Aggregate results

The result of the election
| Party | Seats | Gains | Losses | Net gain/loss | Seats % | Votes % | Votes | +/− | |
|---|---|---|---|---|---|---|---|---|---|
| Conservative | 8 | 0 | 2 | 66.67 | 48.69 | 9,627 | |||
| Independent | 2 | 0 | 0 | 16.67 | 11.86 | 2,345 | |||
| SSLD | 1 | 1 | 0 | 8.33 | 18.08 | 3,576 | |||
| Labour | 1 | 1 | 0 | 8.33 | 9.99 | 1,975 | |||
| SNP | 0 | 0 | 0 | 0 | 6.84 | 1,353 | |||
| SDP | 0 | 0 | 0 | 0 | 2.81 | 555 | New | ||
| Ind. Conservative | 0 | 0 | 0 | 0 | 1.73 | 343 | New | ||
References
- 1 2 "District Council Elections: Key Councils - How the Parties Polled". The Glasgow Herald. 7 May 1988. p. 6.
- ↑ "District Council Elections: Key Councils - How the Parties Polled". The Glasgow Herald. 6 May 1988. p. 10.
| Metropolitan boroughs |
|
|---|---|
| District councils (England) |
|
| District councils (Scotland) |
|
This article is issued from Wikipedia. The text is licensed under Creative Commons - Attribution - Sharealike. Additional terms may apply for the media files.