| |||||||||||||||||||||||||||||||||||||||||||||||||
24 of 66 seats (One Third and two by-elections) to Wirral Metropolitan Borough Council 34 seats needed for a majority | |||||||||||||||||||||||||||||||||||||||||||||||||
|---|---|---|---|---|---|---|---|---|---|---|---|---|---|---|---|---|---|---|---|---|---|---|---|---|---|---|---|---|---|---|---|---|---|---|---|---|---|---|---|---|---|---|---|---|---|---|---|---|---|
| Turnout | 46.6% ( | ||||||||||||||||||||||||||||||||||||||||||||||||
| |||||||||||||||||||||||||||||||||||||||||||||||||
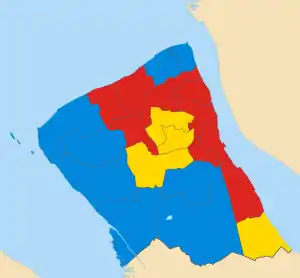 Map of results of 1986 election | |||||||||||||||||||||||||||||||||||||||||||||||||
| |||||||||||||||||||||||||||||||||||||||||||||||||

The 1986 Wirral Metropolitan Borough Council election took place on 8 May 1986 to elect members of Wirral Metropolitan Borough Council in England.[2] This election was held on the same day as other local elections.
After the election, the composition of the council was:
| Party | Seats | ± | |
|---|---|---|---|
| Conservative | 30 | ||
| Labour | 26 | ||
| Alliance | 10 | ||
Election results
Overall election result
Overall result compared with 1984.
| Wirral Metropolitan Borough Council election results, 1986 | |||||||||||||||
|---|---|---|---|---|---|---|---|---|---|---|---|---|---|---|---|
| Party | Candidates | Votes | |||||||||||||
| Stood | Elected | Gained | Unseated | Net | % of total | % | No. | Net % | |||||||
| Labour | 24 | 10 | 2 | 0 | 45.5 | 37.3 | 44,991 | ||||||||
| Conservative | 24 | 9 | 0 | 4 | 36.4 | 34.6 | 41,772 | ||||||||
| Alliance | 24 | 5 | 2 | 0 | 18.2 | 24.7 | 29,813 | ||||||||
| Residents | 2 | 0 | 0 | 0 | 0.0 | 2.1 | 2,551 | N/A | |||||||
| Green | 8 | 0 | 0 | 0 | 0.0 | 1.3 | 1,554 | ||||||||
Ward results
Bebington
| Party | Candidate | Votes | % | ±% | |
|---|---|---|---|---|---|
| Conservative | A. Green | 2,860 | 49.0 | ||
| Labour | William Nock | 1,826 | 31.3 | ||
| Alliance | Kevin Turner | 1,049 | 18.0 | ||
| Green | K. McKee | 107 | 1.8 | New | |
| Majority | 1,034 | 17.7 | |||
| Registered electors | 11,329 | ||||
| Turnout | 51.6 | ||||
| Conservative hold | Swing | ||||
Bidston
| Party | Candidate | Votes | % | ±% | |
|---|---|---|---|---|---|
| Labour | John Cocker | 3,198 | 83.6 | ||
| Conservative | W. Houldin | 331 | 8.7 | ||
| Alliance | K. Hughes | 296 | 7.7 | ||
| Majority | 2,867 | 74.9 | |||
| Registered electors | 10,115 | ||||
| Turnout | 37.8 | ||||
| Labour hold | Swing | ||||
Birkenhead
| Party | Candidate | Votes | % | ±% | |
|---|---|---|---|---|---|
| Labour | W. Craig | 3,139 | 70.0 | ||
| Alliance | R. Francis | 987 | 22.0 | ||
| Conservative | L. Jones | 357 | 8.0 | ||
| Majority | 2,152 | 48.0 | |||
| Registered electors | 11,300 | ||||
| Turnout | 39.7 | ||||
| Labour hold | Swing | ||||
Bromborough
| Party | Candidate | Votes | % | ±% | |
|---|---|---|---|---|---|
| Labour | E. Williams | 2,789 | 52.4 | ||
| Conservative | C. Suffield | 1,573 | 29.6 | ||
| Alliance | F. Mushrow | 961 | 18.1 | ||
| Majority | 1,216 | 22.8 | |||
| Registered electors | 11,615 | ||||
| Turnout | 45.8 | ||||
| Labour hold | Swing | ||||
Clatterbridge
| Party | Candidate | Votes | % | ±% | |
|---|---|---|---|---|---|
| Conservative | Myrra Lea | 3,403 | 54.1 | ||
| Alliance | Stephen Niblock | 1,650 | 26.2 | ||
| Labour | G. Chalinor | 1,234 | 19.6 | ||
| Majority | 1,753 | 27.9 | |||
| Registered electors | 13,808 | ||||
| Turnout | 45.5 | ||||
| Conservative hold | Swing | ||||
Claughton
| Party | Candidate | Votes | % | ±% | |
|---|---|---|---|---|---|
| Alliance | Roy Perkins | 2,102 | 37.8 | ||
| Labour | J. Pennington | 1,678 | 30.2 | ||
| Conservative | C. Bowditch | 1,669 | 30.0 | ||
| Green | K. Cuthbertson | 109 | 2.0 | New | |
| Majority | 424 | 7.6 | N/A | ||
| Registered electors | 10,957 | ||||
| Turnout | 50.7 | ||||
| Alliance hold | Swing | ||||
Eastham
| Party | Candidate | Votes | % | ±% | |
|---|---|---|---|---|---|
| Alliance | Phillip Gilchrist | 3,385 | 55.4 | ||
| Labour | P. Spruce | 1,650 | 27.0 | ||
| Conservative | Mary Jordan | 1,075 | 17.6 | ||
| Majority | 1,735 | 28.4 | |||
| Registered electors | 12,044 | ||||
| Turnout | 50.7 | ||||
| Alliance hold | Swing | ||||
Egerton
| Party | Candidate | Votes | % | ±% | |
|---|---|---|---|---|---|
| Labour | P. Williams | 2,842 | 54.4 | ||
| Conservative | Hilary Jones | 1,171 | 22.4 | ||
| Alliance | W. Wood | 1,082 | 20.7 | ||
| Green | David Pye | 130 | 2.5 | New | |
| Majority | 1,671 | 32.0 | |||
| Registered electors | 11,481 | ||||
| Turnout | 45.5 | ||||
| Labour hold | Swing | ||||
Heswall
| Party | Candidate | Votes | % | ±% | |
|---|---|---|---|---|---|
| Conservative | T. Price | 3,851 | 63.0 | ||
| Alliance | Robert Wilkins | 1,696 | 27.8 | ||
| Labour | George Davies | 563 | 9.2 | ||
| Majority | 2,155 | 35.3 | |||
| Registered electors | 13,126 | ||||
| Turnout | 46.5 | ||||
| Conservative hold | Swing | ||||
Hoylake
| Party | Candidate | Votes | % | ±% | |
|---|---|---|---|---|---|
| Conservative | R. Amyes | 2,671 | 43.9 | ||
| Residents | J. Leonard | 1,498 | 24.6 | New | |
| Alliance | J. Otterson | 1,347 | 22.2 | ||
| Labour | P. Morrin | 565 | 9.3 | ||
| Majority | 1,173 | 19.3 | |||
| Registered electors | 12,549 | ||||
| Turnout | 48.5 | ||||
| Conservative hold | Swing | ||||
Leasowe
| Party | Candidate | Votes | % | ±% | |
|---|---|---|---|---|---|
| Labour | John George | 2,591 | 62.2 | ||
| Conservative | L. Kennedy | 964 | 23.1 | ||
| Alliance | B. Thomas | 610 | 14.6 | ||
| Majority | 1,627 | 39.1 | |||
| Registered electors | 10,091 | ||||
| Turnout | 41.3 | ||||
| Labour hold | Swing | ||||
Liscard
| Party | Candidate | Votes | % | ±% | |
|---|---|---|---|---|---|
| Labour | Gordon Paterson | 2,724 | 45.9 | ||
| Conservative | S. Morgan | 2,267 | 38.2 | ||
| Alliance | John Uriel | 943 | 15.9 | ||
| Majority | 457 | 7.7 | N/A | ||
| Registered electors | 11,962 | ||||
| Turnout | 49.6 | ||||
| Labour gain from Conservative | Swing | ||||
Moreton
| Party | Candidate | Votes | % | ±% | |
|---|---|---|---|---|---|
| Labour | Stuart Marshall-Clarke | 2,311 | 46.0 | ||
| Conservative | W. Leigh | 1,773 | 35.3 | ||
| Alliance | J. Eyres | 939 | 18.7 | ||
| Majority | 538 | 10.7 | N/A | ||
| Registered electors | 9,298 | ||||
| Turnout | 54.0 | ||||
| Labour gain from Conservative | Swing | ||||
New Brighton
| Party | Candidate | Votes | % | ±% | |
|---|---|---|---|---|---|
| Conservative | Jack Redhead | 2,150 | 40.0 | ||
| Labour | A. Clark | 1,978 | 36.8 | ||
| Alliance | R. Curphey | 1,243 | 23.1 | ||
| Majority | 172 | 3.2 | |||
| Registered electors | 11,818 | ||||
| Turnout | 45.4 | ||||
| Conservative hold | Swing | ||||
Oxton
| Party | Candidate | Votes | % | ±% | |
|---|---|---|---|---|---|
| Alliance | Gordon Lindsay | 2,607 | 48.6 | ||
| Conservative | Leonard Moore | 1,394 | 26.0 | ||
| Labour | T. Kelly | 1,248 | 23.3 | ||
| Green | A. Tebbs | 112 | 2.1 | ||
| Majority | 1,213 | 22.6 | |||
| Registered electors | 11,402 | ||||
| Turnout | 47.0 | ||||
| Alliance hold | Swing | ||||
Prenton
| Party | Candidate | Votes | % | ±% | |
|---|---|---|---|---|---|
| Alliance | Edward Cunniffe [n 2] | 2,681 | 40.4 | ||
| Alliance | John Thornton [n 3] | 2,655 | – | – | |
| Conservative | M. Baker | 2,106 | 31.7 | ||
| Conservative | R. Stretch | 1,934 | – | – | |
| Labour | John Clark [n 4] | 1,739 | 26.2 | ||
| Labour | L. Blair | 1,722 | – | – | |
| Green | C. Pye | 109 | 1.6 | New | |
| Majority | 575 | 8.7 | N/A | ||
| Registered electors | 12,580 | ||||
| Turnout | 53.9 | ||||
| Alliance gain from Conservative | Swing | ||||
| Alliance gain from Conservative | Swing | – | |||
Royden
| Party | Candidate | Votes | % | ±% | |
|---|---|---|---|---|---|
| Conservative | W. Lloyd | 2,848 | 49.0 | ||
| Residents | W. Evans | 1,053 | 18.1 | New | |
| Alliance | Peter Reisdorf | 989 | 17.0 | ||
| Labour | C. Harrison | 923 | 15.9 | ||
| Majority | 1,795 | 30.9 | |||
| Registered electors | 12,648 | ||||
| Turnout | 46.0 | ||||
| Conservative hold | Swing | ||||
Seacombe
| Party | Candidate | Votes | % | ±% | |
|---|---|---|---|---|---|
| Labour | A. Cowderoy | 3,377 | 67.9 | ||
| Conservative | F. Hunter | 928 | 18.7 | ||
| Alliance | D. Kelly | 667 | 13.4 | ||
| Majority | 2,449 | 49.3 | |||
| Registered electors | 12,053 | ||||
| Turnout | 41.3 | ||||
| Labour hold | Swing | ||||
Thurstaston
| Party | Candidate | Votes | % | ±% | |
|---|---|---|---|---|---|
| Conservative | David Fletcher [n 2] | 3,008 | 49.3 | ||
| Conservative | Jeffrey Green [n 3] | 2,970 | – | – | |
| Alliance | Charles Wall | 1,235 | 20.2 | ||
| Alliance | Ray Pullen | 1,109 | – | – | |
| Labour | M. Cooper | 1,036 | 17.0 | ||
| Green | David Burton | 823 | 13.5 | New | |
| Labour | P. Connell | 813 | – | – | |
| Majority | 1,773 | 29.1 | |||
| Registered electors | 12,663 | ||||
| Turnout | 45.9 | ||||
| Conservative hold | Swing | ||||
| Conservative hold | Swing | – | |||
Tranmere
| Party | Candidate | Votes | % | ±% | |
|---|---|---|---|---|---|
| Labour | William Davies | 3,239 | 77.0 | ||
| Conservative | J. Hockaday | 466 | 11.1 | ||
| Alliance | G. Pumford | 420 | 10.0 | ||
| Green | Garnette Bowler | 83 | 2.0 | New | |
| Majority | 2,773 | 65.9 | |||
| Registered electors | 11,003 | ||||
| Turnout | 38.2 | ||||
| Labour hold | Swing | ||||
Upton
| Party | Candidate | Votes | % | ±% | |
|---|---|---|---|---|---|
| Labour | Hugh Lloyd | 3,048 | 50.3 | ||
| Conservative | Geoffrey Watt | 1,793 | 29.6 | ||
| Alliance | Eric Copestake | 1,142 | 18.8 | ||
| Green | Cecil Bowler | 81 | 1.3 | New | |
| Majority | 1,255 | 20.7 | |||
| Registered electors | 12,586 | ||||
| Turnout | 48.2 | ||||
| Labour hold | Swing | ||||
Wallasey
| Party | Candidate | Votes | % | ±% | |
|---|---|---|---|---|---|
| Conservative | P. Moir | 3,114 | 50.3 | ||
| Alliance | P. Rimmer | 1,782 | 28.8 | ||
| Labour | G. Kenna | 1,293 | 20.9 | ||
| Majority | 1,332 | 21.5 | |||
| Registered electors | 12,268 | ||||
| Turnout | 50.4 | ||||
| Conservative hold | Swing | ||||
Notes
• italics denote the sitting councillor • bold denotes the winning candidate
References
- 1 2 "Local Election Summaries 1986". The Elections Centre. Retrieved 6 January 2019.
- 1 2 3 4 5 6 7 8 9 10 11 12 13 14 15 16 17 18 19 20 21 22 23 24 "Metropolitan Borough of Wirral Election Results 1973-2012 (Pg. 7 and 8)" (PDF). The Elections Centre. Retrieved 6 January 2019.
- ↑ "Council compositions". The Elections Centre. Retrieved 27 July 2018.
- ↑ "Councillor Steve Niblock". Wirral Metropolitan Borough Council.
- ↑ "Councillor Phil Gilchrist". Wirral Metropolitan Borough Council. 6 August 2023.
- ↑ "Councillor Mary Jordan". Wirral Metropolitan Borough Council. 6 August 2023.
- ↑ "Councillor Bob Wilkins". Wirral Metropolitan Borough Council. Archived from the original on 5 July 2018. Retrieved 6 January 2019.
- ↑ "Councillor George Davies". Wirral Metropolitan Borough Council. 6 August 2023.
- ↑ "Councillor Peter Reisdorf". Wirral Metropolitan Borough Council.
- ↑ "Councillor Jeff Green". Wirral Metropolitan Borough Council. 6 August 2023.
- ↑ "Councillor Bill Davies". Wirral Metropolitan Borough Council. Archived from the original on 12 June 2018. Retrieved 6 January 2019.
- ↑ "Councillor Geoffrey Watt". Wirral Metropolitan Borough Council.
Mellows-Facer, Adam (10 May 2006). "Local election 2006". parliament.uk. Retrieved 29 December 2018.
"BBC NEWS VOTE 2003 WIRRAL". BBC News. 1 May 2003. Retrieved 29 December 2018.
| London boroughs |
|
|---|---|
| Metropolitan boroughs |
|
| District councils (England) |
|
| Regional councils (Scotland) |
|
| LEAs | |
This article is issued from Wikipedia. The text is licensed under Creative Commons - Attribution - Sharealike. Additional terms may apply for the media files.