| |||||||||||||||||||||||||||||||||
All 48 seats on Cork County Council | |||||||||||||||||||||||||||||||||
|---|---|---|---|---|---|---|---|---|---|---|---|---|---|---|---|---|---|---|---|---|---|---|---|---|---|---|---|---|---|---|---|---|---|
| |||||||||||||||||||||||||||||||||
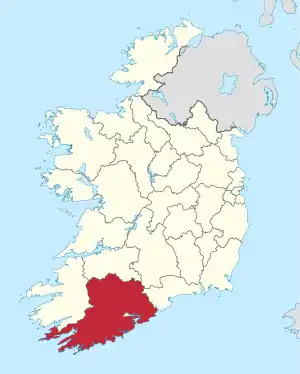 Map showing the area of Cork County Council | |||||||||||||||||||||||||||||||||
| |||||||||||||||||||||||||||||||||
An election to Cork County Council took place on 20 June 1985 as part of that year's Irish local elections. 48 councillors were elected from eight local electoral areas (LEAs) for a five-year term of office on the electoral system of proportional representation by means of the single transferable vote (PR-STV). This term was extended for a further year, to 1991.[1]
Results by party
| Party | Seats | ± | First Pref. votes | FPv% | ±% | |
|---|---|---|---|---|---|---|
| Fianna Fáil | 24 | +3 | 54,692 | 46.97 | ||
| Fine Gael | 19 | 0 | 44,924 | 38.58 | ||
| Labour | 2 | -1 | 5,431 | 4.66 | ||
| Workers' Party | 1 | 0 | 4,370 | 3.75 | ||
| Independent | 2 | 0 | 6,388 | 5.49 | ||
| Totals | 48 | +2 | 116,444 | 100.00 | — | |
Results by local electoral area
Bandon
| Party | Candidate | FPv% | Count | ||||||||
|---|---|---|---|---|---|---|---|---|---|---|---|
| 1 | 2 | 3 | 4 | 5 | 6 | 7 | 8 | ||||
| Fine Gael | Michael Creed TD* | 3,521 | |||||||||
| Fianna Fáil | Peter Callanan* | 3,007 | |||||||||
| Fianna Fáil | Donal Moynihan TD* | 2,921 | |||||||||
| Fine Gael | Eddie Lucey* | 2,448 | |||||||||
| Fine Gael | Denis O'Reilly* | 1,952 | 2,015 | 2,123 | 2,134 | 2,167 | 2,332 | 2,363 | 2,557 | ||
| Fine Gael | John Kelleher* | 1,947 | 2,592 | ||||||||
| Fianna Fáil | Jim Long* | 1,619 | 1,694 | 2,005 | 2,350 | 2,407 | 2,419 | ||||
| Independent | Dermot Ryan | 1,105 | 1,122 | 1,139 | 1,150 | 1,200 | 1,201 | 1,203 | 1,508 | ||
| Fianna Fáil | Michael Ring | 884 | 901 | 1,013 | 1,145 | 1,164 | 1,165 | 1,167 | |||
| Independent | Maurice Hurley | 166 | 187 | 233 | 242 | ||||||
| Electorate: 28,858 Valid: 19,300 (67.67) Spoilt: 229 Quota: 2,413 Turnout: 19,529 | |||||||||||
Cork North
| Party | Candidate | FPv% | Count | |||
|---|---|---|---|---|---|---|
| 1 | 2 | 3 | ||||
| Fianna Fáil | Denis Lyons TD* | 2,107 | ||||
| Fine Gael | Tomas Ryan* | 1,622 | 1,669 | |||
| Fianna Fáil | Donal O'Connell* | 1,363 | 1,539 | 1,685 | ||
| Fine Gael | George Osborne* | 1,240 | 1,258 | 1,626 | ||
| Fianna Fáil | Michael Granitch | 980 | 1,171 | 1,307 | ||
| Labour | Helen Sheehan | 543 | 565 | |||
| Workers' Party | Patrick Corbett | 345 | 357 | |||
| Electorate: 17,134 Valid: 8,200 (48.32%) Spoilt: 80 Quota: 1,641 Turnout: 8,280 | ||||||
Cork South
| Party | Candidate | FPv% | Count | |||||||
|---|---|---|---|---|---|---|---|---|---|---|
| 1 | 2 | 3 | 4 | 5 | 6 | 7 | ||||
| Fianna Fáil | Barry Cogan* | 2,177 | ||||||||
| Fianna Fáil | Batt O'Keeffe | 1,855 | ||||||||
| Fianna Fáil | John Coleman | 1,389 | 1,678 | 1,750 | ||||||
| Fine Gael | Phil Brown | 985 | 1,008 | 1,009 | 1,019 | 1,075 | 1,286 | 1,710 | ||
| Fianna Fáil | Joe O'Reilly | 978 | 1,032 | 1,071 | 1,133 | 1,268 | 1,441 | 1,468 | ||
| Fine Gael | Connell Fanning | 926 | 930 | 955 | 1,024 | 1,056 | 1,148 | |||
| Fine Gael | Braham Brennan | 924 | 961 | 962 | 983 | 1,018 | 1,195 | 1,591 | ||
| Labour | Paula Desmond | 840 | 891 | 896 | 1,172 | 1,319 | 1,397 | 1,541 | ||
| Fine Gael | Jim Daly | 695 | 701 | 702 | 709 | 781 | ||||
| Independent | Mark Hanley | 625 | 638 | 641 | 655 | |||||
| Labour | Gus Desmond | 444 | 452 | 468 | ||||||
| Electorate: 33,220 Valid: 14,021 (42.2%) Spoilt: 99 Quota: 2,004 Turnout: 14,120 (42.5%) | ||||||||||
Kanturk
| Party | Candidate | FPv% | Count | |||||||
|---|---|---|---|---|---|---|---|---|---|---|
| 1 | 2 | 3 | 4 | 5 | 6 | 7 | ||||
| Fine Gael | Frank Crowley TD* | 2,477 | ||||||||
| Fianna Fáil | Jack Roche* | 2,301 | ||||||||
| Fianna Fáil | Mike Donegan* | 1,842 | 1,886 | 1,899 | 2,124 | 2,154 | 2,183 | 2,186 | ||
| Fine Gael | Charles Barry* | 1,606 | 1,752 | 1,843 | 1,881 | 2,281 | ||||
| Fianna Fáil | J.B. Murphy | 1,590 | 1,655 | 1,664 | 1,995 | 2,227 | ||||
| Fine Gael | Richard Green | 1,360 | 1,466 | 1,507 | 1,525 | 1,909 | 1,913 | 1,965 | ||
| Fianna Fáil | Laurence Kelly | 1,356 | 1,468 | 1,494 | 1,892 | 1,952 | 1,995 | 1,996 | ||
| Fine Gael | Noel Buckley | 1,140 | 1,283 | 1,323 | 1,390 | |||||
| Labour | Michael J. Howard* | 1,137 | 1,185 | 1,217 | ||||||
| Labour | Danny Buckley | 0.6% | 760 | |||||||
| Electorate: 22,109 Valid: 15,569 (71.09%) Spoilt: 132 Quota: 2,225 Turnout: 15,701 | ||||||||||
Mallow
| Party | Candidate | FPv% | Count | ||||||||
|---|---|---|---|---|---|---|---|---|---|---|---|
| 1 | 2 | 3 | 4 | 5 | 6 | 7 | 8 | ||||
| Workers' Party | Joe Sherlock* | 3,447 | |||||||||
| Fianna Fáil | Ned O'Keeffe TD | 3,112 | |||||||||
| Fianna Fáil | Carey Joyce* | 2,728 | |||||||||
| Fine Gael | Jim Sarsfield* | 1,711 | 1,764 | 1,790 | 1,821 | 1,837 | 1,874 | 1,889 | 1,997 | ||
| Fine Gael | Dick Fitzgerald* | 1,675 | 1,748 | 1,804 | 1,814 | 1,847 | 1,867 | 1,884 | 2,097 | ||
| Fine Gael | Paul Bradford | 1,347 | 1,439 | 1,453 | 1,456 | 1,614 | 1,687 | 1,749 | 2,487 | ||
| Fianna Fáil | Gerry Sheedy | 1,298 | 1,454 | 1,737 | 1,866 | 1,887 | 2,025 | 2,234 | 2,313 | ||
| Fine Gael | Michael Broderick* | 1,247 | 1,298 | 1,316 | 1,319 | 1,366 | 1,483 | 1,679 | |||
| Fianna Fáil | Ted O'Riordan | 1,071 | 1,204 | 1,310 | 1,338 | 1,469 | 1,561 | 2,134 | 2,230 | ||
| Fianna Fáil | Gerry Fitzpatrick* | 1,050 | 1,143 | 1,234 | 1,257 | 1,308 | 1,450 | ||||
| Independent | John O'Keeffe | 689 | 787 | 815 | 833 | 881 | |||||
| Labour | Tadhg Curtis | 463 | 681 | 691 | 694 | ||||||
| Electorate: 30,365 Valid: 19,838 (65.81%) Spoilt: 144 Quota: 2,480 Turnout: 19,982 | |||||||||||
Midleton
| Party | Candidate | FPv% | Count | |||||||||
|---|---|---|---|---|---|---|---|---|---|---|---|---|
| 1 | 2 | 3 | 4 | 5 | 6 | 7 | 8 | 9 | ||||
| Fine Gael | Michael Hegarty | 2,296 | 2,327 | |||||||||
| Independent | Noel Collins* | 2,059 | 2,170 | 2,367 | ||||||||
| Fianna Fáil | Maurice Ahern* | 1,885 | 1,901 | 1,970 | 1,973 | 1,985 | 2,022 | 2,067 | 2,080 | 2,485 | ||
| Fine Gael | Matt Ahern* | 1,824 | 1,841 | 1,885 | 1,886 | 1,886 | 1,988 | 2,005 | 2,205 | 2,273 | ||
| Fianna Fáil | John Brosnan* | 1,794 | 1,807 | 1,827 | 1,828 | 1,828 | 2,051 | 2,106 | 2,119 | 2,262 | ||
| Fianna Fáil | Kevin Foster* | 1,703 | 1,736 | 1,756 | 1,757 | 1,757 | 1,773 | 1,950 | 2,226 | 2,373 | ||
| Fine Gael | Nuala Murphy* | 1,055 | 1,087 | 1,157 | 1,160 | 1,169 | 1,191 | 1,224 | 1,419 | 1,477 | ||
| Fianna Fáil | Micheal Lombard | 808 | 821 | 852 | 852 | 858 | 869 | 884 | 888 | |||
| Fine Gael | Stella Meade | 657 | 686 | 697 | 702 | 705 | 739 | 858 | ||||
| Labour | Thomas O Conaill | 584 | 607 | 613 | 614 | 618 | ||||||
| Workers' Party | Leo Owens | 578 | 617 | 629 | 630 | 632 | 702 | |||||
| Independent | Donal Wall | 505 | 526 | |||||||||
| Green | Sean Bell | 355 | ||||||||||
| Electorate: 26,391 Valid: 16,150 (62.02%) Spoilt: 218 Quota: 2,220 Turnout: 16,368 | ||||||||||||
Skibbereen
| Party | Candidate | FPv% | Count | |||||||
|---|---|---|---|---|---|---|---|---|---|---|
| 1 | 2 | 3 | 4 | 5 | 6 | 7 | ||||
| Fianna Fáil | Joe Walsh TD* | 3,569 | ||||||||
| Fine Gael | John Cal McCarthy* | 2,349 | ||||||||
| Fianna Fáil | D.F. O'Sullivan* | 2,049 | ||||||||
| Fine Gael | John L. O'Sullivan* | 1,682 | 2,056 | |||||||
| Labour | Michael Calnan | 1,393 | 1,470 | 1,529 | 1,582 | 1,590 | 1,616 | 2,035 | ||
| Fianna Fáil | Tom O'Neill* | 1,233 | 1,866 | 1,892 | 1,969 | |||||
| Fine Gael | Mary Burke* | 1,089 | 1,125 | 1,246 | 1,277 | 1,290 | 1,311 | 1,860 | ||
| Fine Gael | Michael Collins | 1,039 | 1,077 | 1,234 | 1,248 | 1,251 | 1,264 | |||
| Fianna Fáil | Jim Kingston | 888 | 1,306 | 1,328 | 1,443 | 1,510 | 1,548 | 1,604 | ||
| Sinn Féin | Donnchadh O Sé | 371 | 406 | 412 | ||||||
| Electorate: 22,043 Valid: 15,662 (71.5%) Spoilt: 154 Quota: 1,958 Turnout: 15,816 | ||||||||||
Schull
| Party | Candidate | FPv% | Count | ||||||
|---|---|---|---|---|---|---|---|---|---|
| 1 | 2 | 3 | 4 | 5 | 6 | ||||
| Fianna Fáil | Denis O'Donovan | 1,875 | |||||||
| Fine Gael | P.J. Sheehan TD* | 1,638 | 1,718 | ||||||
| Fine Gael | Michael Harrington* | 1,325 | 1,330 | 1,338 | 1,382 | 1,801 | |||
| Independent | Michael Pat Murphy* | 1,192 | 1,227 | 1,272 | 1,420 | 1,478 | 1,532 | ||
| Fine Gael | James Crowley | 1,150 | 1,165 | 1,179 | 1,254 | 1,273 | 1,302 | ||
| Fianna Fáil | Vivian O'Callaghan* | 1,125 | 1,216 | 1,260 | 1,345 | 1,845 | |||
| Fianna Fáil | Dan Harrington* | 995 | 1,031 | 1,060 | 1,077 | ||||
| Labour | Corney Murphy* | 404 | 414 | 437 | |||||
| Sinn Féin | Thomas Coghlan | 183 | 188 | ||||||
| Electorate: 13,403 Valid: 9,887 (70%) Spoilt: 74 Quota: 1,648 Turnout: 9,961 | |||||||||
References
- ↑ Local Elections (Specification of Local Election Year) Order 1990 (S.I. No. 104 of 1990). Signed on 30 April 1990. Statutory Instrument of the Government of Ireland. Retrieved from Irish Statute Book.
External links
- Official website
- irishelectionliterature
- Department of the Environment, Ireland (28 January 2010). "Local elections, 1985 : election results and transfer of votes in respect of each county, and county borough council : and election statistics relating to all local authorities" (PDF). Department of the Environment. Retrieved 28 October 2019.
This article is issued from Wikipedia. The text is licensed under Creative Commons - Attribution - Sharealike. Additional terms may apply for the media files.