 | |||||||||||||||||||||||||||||||||||||||||||||||||
23 of 63 seats to Trafford Metropolitan Borough Council 32 seats needed for a majority | |||||||||||||||||||||||||||||||||||||||||||||||||
|---|---|---|---|---|---|---|---|---|---|---|---|---|---|---|---|---|---|---|---|---|---|---|---|---|---|---|---|---|---|---|---|---|---|---|---|---|---|---|---|---|---|---|---|---|---|---|---|---|---|
| |||||||||||||||||||||||||||||||||||||||||||||||||
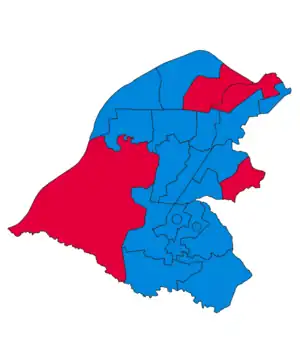 Map of results of 1978 election | |||||||||||||||||||||||||||||||||||||||||||||||||
| |||||||||||||||||||||||||||||||||||||||||||||||||
Elections to Trafford Council were held on Thursday, 4 May 1978. One third of the council was up for election, with each successful candidate to serve a four-year term of office, expiring in 1982. The Conservative Party retained overall control of the council.[1]
Election result
| Party | Votes | Seats | Full Council | |||||||
| Conservative Party | 40,050 (58.5%) | 19 (82.6%) | 19 / 23 |
54 (85.7%) | 54 / 63 | |||||
| Labour Party | 19,076 (27.9%) | 4 (17.4%) | 4 / 23 |
9 (14.3%) | 9 / 63 | |||||
| Liberal Party | 9,180 (13.4%) | 0 (0.0%) | 0 / 23 |
0 (0.0%) | 0 / 63 | |||||
| Communist Party | 136 (0.2%) | 0 (0.0%) | 0 / 23 |
0 (0.0%) | 0 / 63 | |||||
| 9 | 54 |
Ward results
No.1 (Altrincham South West)
| Party | Candidate | Votes | % | ±% | |
|---|---|---|---|---|---|
| Conservative | M. Rubin | 1,131 | 54.4 | +0.9 | |
| Labour | E. McPherson | 590 | 28.4 | +1.6 | |
| Liberal | G. M. R. Willmott | 357 | 17.2 | -2.5 | |
| Majority | 541 | 26.0 | -0.7 | ||
| Turnout | 2,078 | 32.8 | -7.5 | ||
| Conservative gain from Labour | Swing | ||||
No.2 (Altrincham East)
| Party | Candidate | Votes | % | ±% | |
|---|---|---|---|---|---|
| Conservative | G. V. Burrows | 1,993 | 58.2 | +3.7 | |
| Conservative | H. Taylor | 1,922 | 56.1 | +1.6 | |
| Liberal | J. W. Davenport* | 1,126 | 32.9 | +4.5 | |
| Liberal | M. Clancy | 1,019 | 29.7 | +1.3 | |
| Labour | J. R. Royle | 402 | 11.7 | -5.3 | |
| Labour | R. J. Ellis | 394 | 11.5 | -5.5 | |
| Majority | 796 | 23.2 | -2.9 | ||
| Turnout | 3,426 | 37.8 | -4.8 | ||
| Conservative gain from Liberal | Swing | ||||
| Conservative hold | Swing | ||||
No.3 (Altrincham North)
| Party | Candidate | Votes | % | ±% | |
|---|---|---|---|---|---|
| Conservative | M. G. Currie* | 1,264 | 57.3 | +3.0 | |
| Conservative | L. M. L. Burton | 1,187 | 53.8 | -0.5 | |
| Labour | E. Smith | 587 | 26.6 | +5.2 | |
| Labour | G. R. Gould | 542 | 24.6 | +4.2 | |
| Liberal | E. H. Faulkner | 488 | 22.1 | -2.2 | |
| Liberal | B. Gaylard | 341 | 15.5 | -8.8 | |
| Majority | 600 | 27.2 | -2.9 | ||
| Turnout | 2,205 | 35.5 | +5.4 | ||
| Conservative hold | Swing | ||||
| Conservative hold | Swing | ||||
No.4 (Timperley)
| Party | Candidate | Votes | % | ±% | |
|---|---|---|---|---|---|
| Conservative | L. E. W. McCowatt | 1,746 | 69.2 | +21.6 | |
| Labour | C. Moore | 777 | 30.8 | +6.0 | |
| Majority | 969 | 38.4 | +18.4 | ||
| Turnout | 2,523 | 31.2 | -13.3 | ||
| Conservative hold | Swing | ||||
No.5 (Mersey-St. Mary’s)
| Party | Candidate | Votes | % | ±% | |
|---|---|---|---|---|---|
| Conservative | R. Moss | 2,208 | 59.4 | -1.4 | |
| Liberal | E. Critchlow | 973 | 26.2 | -3.2 | |
| Labour | C. Younghusband | 534 | 14.4 | +4.6 | |
| Majority | 1,235 | 33.2 | +1.7 | ||
| Turnout | 3,715 | 41.0 | -4.0 | ||
| Conservative gain from Liberal | Swing | ||||
No.6 (St. Martin’s)
| Party | Candidate | Votes | % | ±% | |
|---|---|---|---|---|---|
| Conservative | M. E. King* | 2,543 | 62.9 | -3.9 | |
| Labour | G. Woodburn | 858 | 21.2 | -12.0 | |
| Liberal | G. C. Kinsey | 550 | 13.6 | +13.6 | |
| Communist | J. E. Stitt | 89 | 2.2 | +2.2 | |
| Majority | 1,685 | 41.7 | +8.0 | ||
| Turnout | 4,040 | 35.3 | -2.9 | ||
| Conservative hold | Swing | ||||
No.7 (Sale Moor)
| Party | Candidate | Votes | % | ±% | |
|---|---|---|---|---|---|
| Labour | R. Mee* | 1,417 | 52.5 | +8.9 | |
| Conservative | G. K. Toft | 1,283 | 47.5 | +3.6 | |
| Majority | 134 | 5.0 | +4.6 | ||
| Turnout | 2,700 | 40.9 | -1.2 | ||
| Labour hold | Swing | ||||
No.8 (St. Anne’s)
| Party | Candidate | Votes | % | ±% | |
|---|---|---|---|---|---|
| Conservative | J. H. Evans | 1,634 | 47.5 | +1.1 | |
| Liberal | J. M. Phillipson* | 1,265 | 36.8 | +5.5 | |
| Labour | B. Brotherton | 541 | 15.7 | -6.6 | |
| Majority | 369 | 10.7 | -4.4 | ||
| Turnout | 3,440 | 40.4 | -4.9 | ||
| Conservative gain from Liberal | Swing | ||||
No.9 (Brooklands)
| Party | Candidate | Votes | % | ±% | |
|---|---|---|---|---|---|
| Conservative | J. A. E. Waterfall | 2,685 | 63.8 | -1.0 | |
| Liberal | C. S. Fink* | 1,098 | 26.1 | -9.1 | |
| Labour | A. J. Hadley | 426 | 10.1 | +10.1 | |
| Majority | 1,587 | 37.7 | +8.2 | ||
| Turnout | 4,209 | 47.1 | +1.9 | ||
| Conservative gain from Liberal | Swing | ||||
No.10 (Talbot North)
| Party | Candidate | Votes | % | ±% | |
|---|---|---|---|---|---|
| Labour | G. Marland* | 1,780 | 61.5 | +8.7 | |
| Conservative | W. Outhwaite | 1,113 | 38.5 | +4.7 | |
| Majority | 667 | 23.0 | +4.0 | ||
| Turnout | 2,893 | 33.3 | -4.6 | ||
| Labour hold | Swing | ||||
No.11 (Clifford)
| Party | Candidate | Votes | % | ±% | |
|---|---|---|---|---|---|
| Conservative | K. G. Summerfield | 1,319 | 50.1 | +7.2 | |
| Labour | J. S. Maher | 1,318 | 50.0 | +0.4 | |
| Majority | 1 | 0.03 | -6.7 | ||
| Turnout | 2,637 | 39.6 | -1.9 | ||
| Conservative gain from Labour | Swing | ||||
No.12 (Longford)
| Party | Candidate | Votes | % | ±% | |
|---|---|---|---|---|---|
| Conservative | D. W. Homer* | 1,886 | 53.7 | +0.2 | |
| Labour | A. J. Lloyd | 1,284 | 36.5 | +1.8 | |
| Liberal | H. D. Locksley | 343 | 9.8 | -1.9 | |
| Majority | 602 | 17.1 | -1.7 | ||
| Turnout | 3,513 | 34.4 | -4.6 | ||
| Conservative hold | Swing | ||||
No.13 (Stretford)
| Party | Candidate | Votes | % | ±% | |
|---|---|---|---|---|---|
| Conservative | M. Hindley* | 1,591 | 68.5 | +4.1 | |
| Labour | R. A. Tully | 732 | 31.5 | +3.2 | |
| Majority | 859 | 37.0 | +0.9 | ||
| Turnout | 2,323 | 40.0 | -2.3 | ||
| Conservative hold | Swing | ||||
No.14 (Park)
| Party | Candidate | Votes | % | ±% | |
|---|---|---|---|---|---|
| Labour | J. R. Haydock | 1,118 | 49.9 | 0 | |
| Conservative | L. Sherwood | 1,076 | 48.0 | +0.7 | |
| Communist | W. Hudson | 47 | 2.1 | -0.7 | |
| Majority | 42 | 1.9 | -0.7 | ||
| Turnout | 2,241 | 39.1 | -4.2 | ||
| Labour hold | Swing | ||||
No.15 (Bowdon)
| Party | Candidate | Votes | % | ±% | |
|---|---|---|---|---|---|
| Conservative | J. B. Gill* | 2,572 | 77.6 | -7.1 | |
| Liberal | D. F. Mardon | 408 | 12.3 | -3.0 | |
| Labour | G. R. Scott | 333 | 10.1 | +10.1 | |
| Majority | 2,164 | 65.3 | -4.0 | ||
| Turnout | 3,313 | 44.7 | -3.9 | ||
| Conservative hold | Swing | ||||
No.16 (Hale)
| Party | Candidate | Votes | % | ±% | |
|---|---|---|---|---|---|
| Conservative | M. Hinchcliffe* | 2,812 | 75.7 | -11.5 | |
| Liberal | J. S. Whittingham | 501 | 13.5 | +13.5 | |
| Labour | A. D. Johnson | 400 | 10.8 | -2.0 | |
| Majority | 2,311 | 62.2 | -12.2 | ||
| Turnout | 3,713 | 39.9 | -7.5 | ||
| Conservative hold | Swing | ||||
No.17 (Partington)
| Party | Candidate | Votes | % | ±% | |
|---|---|---|---|---|---|
| Labour | F. Holland* | 1,566 | 60.0 | +11.3 | |
| Conservative | J. Strong | 1,043 | 40.0 | -0.1 | |
| Majority | 523 | 20.0 | +11.3 | ||
| Turnout | 2,609 | 33.4 | -4.0 | ||
| Labour hold | Swing | ||||
No.18 (Urmston West East)
| Party | Candidate | Votes | % | ±% | |
|---|---|---|---|---|---|
| Conservative | A. R. Coupe* | 1,725 | 58.8 | +2.0 | |
| Labour | D. Horner | 842 | 28.7 | +4.6 | |
| Liberal | D. E. Unwin | 367 | 12.5 | -6.6 | |
| Majority | 883 | 30.1 | -2.6 | ||
| Turnout | 2,934 | 34.6 | -3.0 | ||
| Conservative hold | Swing | ||||
No.19 (Flixton East Central)
| Party | Candidate | Votes | % | ±% | |
|---|---|---|---|---|---|
| Conservative | W. Wroe* | 2,205 | 72.1 | +9.2 | |
| Labour | J. Shaw | 853 | 27.9 | +5.3 | |
| Majority | 1,352 | 44.2 | +3.9 | ||
| Turnout | 3,058 | 33.2 | -9.7 | ||
| Conservative hold | Swing | ||||
No.20 (Flixton West)
| Party | Candidate | Votes | % | ±% | |
|---|---|---|---|---|---|
| Conservative | G. H. Carnall* | 2,291 | 62.6 | +2.2 | |
| Labour | L. M. Seex | 1,370 | 37.4 | +7.3 | |
| Majority | 921 | 25.2 | -5.1 | ||
| Turnout | 3,661 | 35.8 | -5.4 | ||
| Conservative hold | Swing | ||||
No.21 (Davyhulme East)
| Party | Candidate | Votes | % | ±% | |
|---|---|---|---|---|---|
| Conservative | R. G. Haigh* | 1,221 | 61.8 | +1.9 | |
| Labour | R. P. F. Phillips | 412 | 20.8 | -9.6 | |
| Liberal | T. M. Owen | 344 | 17.4 | +7.7 | |
| Majority | 809 | 40.9 | +11.4 | ||
| Turnout | 1,977 | 36.7 | -4.7 | ||
| Conservative hold | Swing | ||||
References
- ↑ "Trafford M. B. C. Election Results Sheet, 5 May 1978", Trafford M.B.C.(1978).
| London boroughs |
|
|---|---|
| Metropolitan boroughs |
|
| District councils (England) |
|
| Regional councils (Scotland) |
|
This article is issued from Wikipedia. The text is licensed under Creative Commons - Attribution - Sharealike. Additional terms may apply for the media files.