| |||||||||||||||||||||||||||||||||||||||||||||
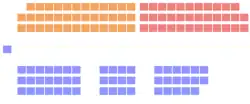
125 seats in the 30th Legislative Assembly of Ontario 63 seats were needed for a majority | |||||||||||||||||||||||||||||||||||||||||||||
|---|---|---|---|---|---|---|---|---|---|---|---|---|---|---|---|---|---|---|---|---|---|---|---|---|---|---|---|---|---|---|---|---|---|---|---|---|---|---|---|---|---|---|---|---|---|
| |||||||||||||||||||||||||||||||||||||||||||||
 | |||||||||||||||||||||||||||||||||||||||||||||


.jpg.webp)
The 1975 Ontario general election was held on September 18, 1975, to elect the 125 members of the 30th Legislative Assembly of Ontario (Members of Provincial Parliament, or "MPPs") of the Province of Ontario, Canada.
The Ontario Progressive Conservative Party, led by Bill Davis and campaigning under the slogan, "Your Future. Your choice.", won a tenth consecutive term in office but lost its majority in the legislature for the first time since the 1945 election. The PC party lost 27 seats from its result in the previous election.
The social democratic Ontario New Democratic Party, led by Stephen Lewis with the slogan "Tomorrow starts today", doubled its representation in the legislature, and became the Official Opposition on the strength of a campaign which called for rent control in Ontario and highlighted horror stories of individuals victimized by bad landlords who imposed exorbitant rent increases. The campaign forced Davis' Tories to promise to implement rent controls shortly before the election.
The Ontario Liberal Party, led by Robert Nixon, won 16 additional seats, but lost the role of Official Opposition to the NDP. One member of its caucus was elected as a Liberal-Labour candidate.
Expansion of Legislative Assembly
An Act passed in May 1975[1] provided for an increase from 117 to 125 MPPs in the next Assembly:
| Abolished ridings | New ridings |
|---|---|
| Drawn from parts of other ridings | |
| Reorganization of ridings | |
| Division of ridings | |
| Renaming of ridings | |
| Consequential renaming of ridings on the creation of the Regional Municipality of Durham | |
- ↑ from part of Lincoln
- ↑ from parts of London North and London South
- ↑ from parts of Scarborough North, Scarborough West and Scarborough Centre
- ↑ from part of Downsview
Campaign
| Candidates | PC | Lib | LL | NDP | Comm | Ind | Ltn | SC | NAL | Total |
|---|---|---|---|---|---|---|---|---|---|---|
| 3 | 66 | 64 | 2 | 66 | 198 | |||||
| 4 | 41 | 41 | 41 | 19 | 5 | 9 | 6 | 2 | 164 | |
| 5 | 15 | 15 | 15 | 11 | 7 | 6 | 5 | 1 | 75 | |
| 6 | 2 | 2 | 2 | 2 | 3 | 1 | 12 | |||
| 7 | 1 | 1 | 1 | 1 | 2 | 1 | 7 | |||
| Total | 125 | 123 | 2 | 125 | 33 | 17 | 15 | 13 | 3 | 456 |
Among the independent candidates, there were 12 from the Social Credit League of Ontario who were not officially recognized as such as the party did not qualify for official party status under the Election Finances Reform Act, 1975.[3][4][5][6]
Results
Summary
| Political party | Party leader | MPPs | Votes | |||||||
|---|---|---|---|---|---|---|---|---|---|---|
| Candidates | 1971 | 1975 | ± | # | ± | % | ± (pp) | |||
| Progressive Conservative | Bill Davis | 125 | 78 | 51 | 27 | 1,192,592 | 272,721 | 36.07% | 8.43 | |
| New Democratic | Stephen Lewis | 125 | 19 | 38 | 19 | 956,904 | 63,025 | 28.94% | 1.79 | |
| Liberal | Robert Nixon | 123 | 20 | 35 | 15 | 1,125,615 | 211,873 | 34.04% | 6.29 | |
| Liberal–Labour | 2 | – | 1 | 1 | 9,066 | 9,066 | 0.27% | Returned | ||
| Communist | William Stewart | 33 | – | – | – | 9,120 | 7,500 | 0.28% | 0.23 | |
| Libertarian | Terry Coughlin | 15 | – | – | – | 4,437 | 4,437 | 0.13% | New | |
| Social Credit | 13 | – | – | – | 4,146 | 2,942 | 0.13% | 0.09 | ||
| Independent | 17 | – | – | – | 4,093 | 12,866 | 0.12% | 0.40 | ||
| North American Labour | 3 | – | – | – | 424 | 424 | 0.01% | New | ||
| Total | 456 | 117 | 125 | 3,306,397 | 100.00% | |||||
| Rejected ballots | 17,937 | 122 |
||||||||
| Voter turnout | 3,310,776 | 13,558 |
67.82 | 5.71 | ||||||
| Registered electors | 4,503,142 | 398,635 |
||||||||
| Party | Seats | Votes | Change (pp) | ||
|---|---|---|---|---|---|
| █ Progressive Conservative | 51 / 125 | 36.07% | -8.43 | ||
| █ New Democratic | 38 / 125 | 28.94% | 1.79 | ||
| █ Liberal/Liberal-Labour | 36 / 125 | 34.31% | 6.56 | ||
| █ Independent | 0 / 125 | 0.12% | -0.40 | ||
| █ Other | 0 / 125 | 0.56% | 0.48 | ||
Synopsis of results
| Riding | Winning party | Turnout [a 1] |
Votes | ||||||||||||
|---|---|---|---|---|---|---|---|---|---|---|---|---|---|---|---|
| Name[a 2] | 1971 | Party | Votes | Share | Margin # |
Margin % |
PC | Lib/LL | NDP | Ind | Other | Total | |||
| Algoma | PC | NDP | 4,923 | 38.57% | 398 | 3.12% | 72.02% | 4,525 | 3,315 | 4,923 | – | – | 12,763 | ||
| Algoma—Manitoulin | PC | PC | 5,452 | 40.79% | 1,127 | 8.43% | 72.28% | 5,452 | 3,589 | 4,325 | – | – | 13,366 | ||
| Brampton | New | PC | 16,432 | 43.66% | 5,608 | 14.90% | 72.11% | 16,432 | 9,906 | 10,824 | 65 | 410 | 37,637 | ||
| Brantford | PC | NDP | 12,012 | 39.06% | 2,450 | 7.97% | 72.65% | 9,063 | 9,562 | 12,012 | – | 115 | 30,752 | ||
| Brant—Oxford—Norfolk | Lib | Lib | 14,358 | 55.52% | 7,934 | 30.68% | 69.71% | 6,424 | 14,358 | 4,721 | – | 358 | 25,861 | ||
| Brock | New | PC | 10,978 | 48.31% | 5,067 | 22.30% | 65.69% | 10,978 | 5,911 | 5,836 | – | – | 22,725 | ||
| Burlington South | New | PC | 17,093 | 45.83% | 5,751 | 15.42% | 69.50% | 17,093 | 11,342 | 8,859 | – | – | 37,294 | ||
| Cambridge | New | NDP | 11,255 | 38.14% | 1,593 | 5.40% | 66.96% | 8,595 | 9,662 | 11,255 | – | – | 29,512 | ||
| Carleton | PC | PC | 12,653 | 38.87% | 676 | 2.08% | 68.68% | 12,653 | 11,977 | 7,769 | 157 | – | 32,556 | ||
| Carleton East | PC | NDP | 11,982 | 36.02% | 281 | 0.84% | 66.58% | 9,579 | 11,701 | 11,982 | – | – | 33,262 | ||
| Carleton-Grenville | New | PC | 12,759 | 53.80% | 7,027 | 29.63% | 68.88% | 12,759 | 5,226 | 5,732 | – | – | 23,717 | ||
| Chatham—Kent | PC | PC | 10,146 | 43.73% | 2,819 | 12.15% | 61.68% | 10,146 | 7,327 | 5,728 | – | – | 23,201 | ||
| Cochrane North | PC | PC | 9,987 | 61.74% | 6,220 | 38.45% | 66.45% | 9,987 | 2,423 | 3,767 | – | – | 16,177 | ||
| Cochrane South | NDP | NDP | 11,073 | 47.87% | 1,292 | 5.59% | 68.42% | 9,781 | 1,958 | 11,073 | 114 | 205 | 23,131 | ||
| Cornwall | New | NDP | 11,958 | 51.05% | 2,682 | 11.45% | 70.41% | 9,276 | 2,191 | 11,958 | – | – | 23,425 | ||
| Dufferin—Simcoe | PC | PC | 14,201 | 45.88% | 1,691 | 5.46% | 68.52% | 14,201 | 12,510 | 3,585 | – | 655 | 30,951 | ||
| Durham East | PC | NDP | 12,893 | 42.26% | 2,229 | 7.31% | 70.16% | 10,664 | 6,696 | 12,893 | – | 258 | 30,511 | ||
| Durham North | PC | PC | 11,206 | 39.28% | 111 | 0.39% | 74.12% | 11,206 | 11,095 | 6,230 | – | – | 28,531 | ||
| Durham West | PC | NDP | 11,356 | 38.99% | 1,314 | 4.51% | 72.71% | 7,579 | 10,042 | 11,356 | – | 149 | 29,126 | ||
| Elgin | PC | PC | 11,880 | 43.98% | 1,829 | 6.77% | 71.27% | 11,880 | 10,051 | 5,084 | – | – | 27,015 | ||
| Erie | Lib | Lib | 9,556 | 45.27% | 2,650 | 12.55% | 69.35% | 4,646 | 9,556 | 6,906 | – | – | 21,108 | ||
| Essex North | Lib | Lib | 9,550 | 44.05% | 1,872 | 8.64% | 67.73% | 4,451 | 9,550 | 7,678 | – | – | 21,679 | ||
| Essex South | Lib | Lib | 9,517 | 41.34% | 2,122 | 9.22% | 67.05% | 7,395 | 9,517 | 6,108 | – | – | 23,020 | ||
| Fort William | PC | NDP | 9,173 | 36.59% | 953 | 3.80% | 64.61% | 8,220 | 7,444 | 9,173 | – | 230 | 25,067 | ||
| Frontenac—Addington | PC | Lib | 10,372 | 44.63% | 1,415 | 6.09% | 70.78% | 8,957 | 10,372 | 3,368 | 545 | – | 23,242 | ||
| Grey | PC | Lib | 11,686 | 45.02% | 277 | 1.07% | 73.81% | 11,409 | 11,686 | 2,863 | – | – | 25,958 | ||
| Grey—Bruce | Lib | Lib | 14,193 | 55.39% | 5,964 | 23.28% | 75.71% | 8,229 | 14,193 | 3,202 | – | – | 25,624 | ||
| Haldimand—Norfolk | PC | Lib | 13,976 | 45.36% | 1,955 | 6.35% | 71.99% | 12,021 | 13,976 | 4,814 | – | – | 30,811 | ||
| Halton—Burlington | New | Lib | 10,998 | 39.14% | 463 | 1.65% | 72.75% | 10,535 | 10,998 | 6,567 | – | – | 28,100 | ||
| Hamilton Centre | NDP | NDP | 8,114 | 38.43% | 586 | 2.78% | 56.70% | 5,256 | 7,528 | 8,114 | – | 214 | 21,112 | ||
| Hamilton East | NDP | NDP | 14,415 | 47.89% | 5,736 | 19.06% | 64.10% | 6,407 | 8,679 | 14,415 | – | 601 | 30,102 | ||
| Hamilton Mountain | PC | PC | 12,769 | 38.80% | 1,727 | 5.25% | 72.64% | 12,769 | 8,921 | 11,042 | – | 177 | 32,909 | ||
| Hamilton West | PC | Lib | 10,583 | 38.34% | 542 | 1.96% | 66.04% | 10,041 | 10,583 | 6,978 | – | – | 27,602 | ||
| Hastings—Peterborough | PC | PC | 10,912 | 47.89% | 2,341 | 10.27% | 71.01% | 10,912 | 8,571 | 2,969 | – | 335 | 22,787 | ||
| Huron—Bruce | Lib | Lib | 16,276 | 65.70% | 10,393 | 41.95% | 73.52% | 5,883 | 16,276 | 2,613 | – | – | 24,772 | ||
| Huron—Middlesex | New | Lib | 11,893 | 54.04% | 3,795 | 17.24% | 76.12% | 8,098 | 11,893 | 2,018 | – | – | 22,009 | ||
| Kenora | PC | PC | 9,584 | 52.42% | 4,060 | 22.21% | 67.40% | 9,584 | 3,174 | 5,524 | – | – | 18,282 | ||
| Kent—Elgin | Lib | Lib | 12,793 | 56.57% | 5,232 | 23.13% | 70.31% | 7,561 | 12,793 | 2,262 | – | – | 22,616 | ||
| Kingston and the Islands | PC | PC | 9,442 | 37.82% | 203 | 0.81% | 65.01% | 9,442 | 9,239 | 6,161 | – | 124 | 24,966 | ||
| Kitchener | Lib | Lib | 13,036 | 44.83% | 4,710 | 16.20% | 63.50% | 8,326 | 13,036 | 7,327 | – | 392 | 29,081 | ||
| Kitchener—Wilmot | New | Lib | 9,929 | 40.71% | 1,745 | 7.16% | 64.38% | 6,275 | 9,929 | 8,184 | – | – | 24,388 | ||
| Lake Nipigon | NDP | NDP | 7,114 | 59.38% | 4,014 | 33.51% | 66.78% | 1,766 | 3,100 | 7,114 | – | – | 11,980 | ||
| Lambton | PC | PC | 11,042 | 51.53% | 1,836 | 8.57% | 73.00% | 11,042 | 9,206 | 1,180 | – | – | 21,428 | ||
| Lanark | PC | PC | 11,641 | 56.58% | 5,799 | 28.18% | 72.17% | 11,641 | 5,842 | 3,092 | – | – | 20,575 | ||
| Leeds | PC | PC | 13,913 | 58.21% | 8,197 | 34.29% | 70.69% | 13,913 | 4,274 | 5,716 | – | – | 23,903 | ||
| Lincoln | PC | Lib | 8,995 | 42.84% | 1,094 | 5.21% | 69.87% | 7,901 | 8,995 | 4,100 | – | – | 20,996 | ||
| London Centre | New | Lib | 11,572 | 40.37% | 2,569 | 8.96% | 61.12% | 9,003 | 11,572 | 7,878 | 213 | – | 28,666 | ||
| London North | PC | Lib | 13,689 | 44.65% | 2,282 | 7.44% | 66.71% | 11,407 | 13,689 | 5,560 | – | – | 30,656 | ||
| London South | PC | Lib | 14,496 | 40.94% | 559 | 1.58% | 64.25% | 13,937 | 14,496 | 6,971 | – | – | 35,404 | ||
| Middlesex | New | PC | 10,092 | 44.97% | 869 | 3.87% | 72.34% | 10,092 | 9,223 | 3,125 | – | – | 22,440 | ||
| Mississauga East | New | PC | 9,973 | 39.05% | 1,335 | 5.23% | 64.95% | 9,973 | 8,638 | 6,499 | 432 | – | 25,542 | ||
| Mississauga North | New | PC | 11,001 | 35.55% | 385 | 1.24% | 67.33% | 11,001 | 9,332 | 10,616 | – | – | 30,949 | ||
| Mississauga South | New | PC | 11,870 | 43.04% | 3,144 | 11.40% | 69.04% | 11,870 | 8,726 | 6,981 | – | – | 27,577 | ||
| Muskoka | PC | PC | 7,061 | 43.97% | 1,376 | 8.57% | 68.73% | 7,061 | 3,200 | 5,685 | – | 111 | 16,057 | ||
| Niagara Falls | PC | Lib | 10,594 | 37.80% | 172 | 0.61% | 65.02% | 10,422 | 10,594 | 7,013 | – | – | 28,029 | ||
| Nickel Belt | NDP | NDP | 10,243 | 60.09% | 6,209 | 36.42% | 72.60% | 4,034 | 2,770 | 10,243 | – | – | 17,047 | ||
| Nipissing | Lib | Lib | 15,483 | 54.35% | 8,244 | 28.94% | 69.44% | 7,239 | 15,483 | 5,110 | 658 | – | 28,490 | ||
| Northumberland | PC | PC | 13,328 | 44.58% | 3,001 | 10.04% | 72.44% | 13,328 | 10,327 | 6,241 | – | – | 29,896 | ||
| Oakville | New | PC | 12,933 | 45.84% | 3,759 | 13.32% | 74.29% | 12,933 | 9,174 | 6,011 | – | 97 | 28,215 | ||
| Oshawa | PC | NDP | 14,638 | 58.94% | 7,787 | 31.35% | 63.27% | 6,851 | 3,202 | 14,638 | – | 146 | 24,837 | ||
| Ottawa Centre | NDP | NDP | 11,658 | 41.07% | 2,680 | 9.44% | 62.19% | 8,978 | 7,500 | 11,658 | – | 250 | 28,386 | ||
| Ottawa East | Lib | Lib | 14,900 | 60.96% | 9,899 | 40.50% | 53.08% | 5,001 | 14,900 | 4,543 | – | – | 24,444 | ||
| Ottawa South | PC | PC | 14,767 | 43.15% | 3,668 | 10.72% | 67.88% | 14,767 | 8,360 | 11,099 | – | – | 34,226 | ||
| Ottawa West | PC | PC | 14,889 | 44.34% | 5,063 | 15.08% | 66.10% | 14,889 | 9,826 | 8,861 | – | – | 33,576 | ||
| Oxford | PC | PC | 17,776 | 50.72% | 5,181 | 14.78% | 71.77% | 17,776 | 12,595 | 4,676 | – | – | 35,047 | ||
| Parry Sound | PC | PC | 8,154 | 44.56% | 966 | 5.28% | 66.77% | 8,154 | 7,188 | 2,957 | – | – | 18,299 | ||
| Perth | Lib | Lib | 17,865 | 63.36% | 10,478 | 37.16% | 65.17% | 7,387 | 17,865 | 2,945 | – | – | 28,197 | ||
| Peterborough | PC | NDP | 16,154 | 39.53% | 505 | 1.24% | 71.23% | 15,649 | 8,979 | 16,154 | – | 83 | 40,865 | ||
| Port Arthur | NDP | NDP | 12,213 | 49.74% | 4,618 | 18.81% | 66.36% | 7,595 | 4,499 | 12,213 | – | 247 | 24,554 | ||
| Prescott and Russell | PC | PC | 11,006 | 43.93% | 2,045 | 8.16% | 68.85% | 11,006 | 8,961 | 5,085 | – | – | 25,052 | ||
| Prince Edward—Lennox | PC | PC | 9,628 | 44.32% | 733 | 3.37% | 74.37% | 9,628 | 8,895 | 3,200 | – | – | 21,723 | ||
| Quinte | PC | Lib | 12,440 | 43.07% | 659 | 2.28% | 67.95% | 11,781 | 12,440 | 4,663 | – | – | 28,884 | ||
| Rainy River | Lib | LL | 5,892 | 51.58% | 2,657 | 23.26% | 64.77% | 3,235 | 5,892[a 3] | 2,295 | – | – | 11,422 | ||
| Renfrew North | PC | Lib | 7,058 | 35.41% | 183 | 0.92% | 70.90% | 6,875 | 7,058 | 6,001 | – | – | 19,934 | ||
| Renfrew South | PC | PC | 13,886 | 54.20% | 5,819 | 22.71% | 75.49% | 13,886 | 8,067 | 3,267 | – | 401 | 25,621 | ||
| St. Catharines | PC | PC | 10,064 | 34.74% | 794 | 2.74% | 59.77% | 10,064 | 9,270 | 9,215 | – | 419 | 28,968 | ||
| Sarnia | Lib | Lib | 16,275 | 57.69% | 7,502 | 26.59% | 63.97% | 8,773 | 16,275 | 2,957 | – | 204 | 28,209 | ||
| Sault Ste. Marie | PC | PC | 14,415 | 42.46% | 945 | 2.78% | 70.91% | 14,415 | 5,835 | 13,470 | – | 232 | 33,952 | ||
| Simcoe Centre | PC | PC | 13,557 | 39.52% | 1,929 | 5.62% | 69.48% | 13,557 | 9,116 | 11,628 | – | – | 34,301 | ||
| Simcoe East | PC | PC | 11,622 | 39.48% | 1,140 | 3.87% | 69.35% | 11,622 | 7,334 | 10,482 | – | – | 29,438 | ||
| Stormont—Dundas—Glengarry | New | PC | 10,833 | 52.54% | 3,851 | 18.68% | 68.99% | 10,833 | 6,982 | 2,804 | – | – | 20,619 | ||
| Sudbury | NDP | NDP | 12,258 | 38.35% | 2,278 | 7.13% | 74.53% | 9,549 | 9,980 | 12,258 | – | 175 | 31,962 | ||
| Sudbury East | NDP | NDP | 18,765 | 58.84% | 9,476 | 29.71% | 74.04% | 3,837 | 9,289 | 18,765 | – | – | 31,891 | ||
| Temiskaming | PC | NDP | 8,713 | 44.07% | 1,544 | 7.81% | 68.53% | 7,169 | 3,546 | 8,713 | 175 | 170 | 19,773 | ||
| Victoria—Haliburton | PC | Lib | 10,907 | 43.53% | 1,023 | 4.08% | 70.64% | 9,884 | 10,907 | 3,707 | – | 556 | 25,054 | ||
| Waterloo North | Lib | Lib | 12,409 | 47.49% | 5,265 | 20.15% | 64.40% | 7,144 | 12,409 | 6,576 | – | – | 26,129 | ||
| Welland | PC | NDP | 9,994 | 36.88% | 1,115 | 4.11% | 71.26% | 8,879 | 8,000 | 9,994 | – | 223 | 27,096 | ||
| Wellington—Dufferin—Peel | PC | PC | 12,110 | 40.61% | 712 | 2.39% | 69.50% | 12,110 | 11,398 | 6,313 | – | – | 29,821 | ||
| Wellington South | Lib | Lib | 15,654 | 50.69% | 7,886 | 25.54% | 68.36% | 7,063 | 15,654 | 7,768 | 252 | 145 | 30,882 | ||
| Wentworth | NDP | NDP | 14,847 | 58.73% | 9,577 | 37.89% | 68.32% | 5,270 | 5,162 | 14,847 | – | – | 25,279 | ||
| Wentworth North | PC | Lib | 13,242 | 40.56% | 1,977 | 6.06% | 72.56% | 11,265 | 13,242 | 8,140 | – | – | 32,647 | ||
| Windsor—Riverside | NDP | NDP | 13,273 | 47.85% | 2,479 | 8.94% | 61.67% | 3,671 | 10,794 | 13,273 | – | – | 27,738 | ||
| Windsor—Sandwich | NDP | NDP | 10,624 | 49.73% | 3,067 | 14.36% | 58.25% | 2,732 | 7,557 | 10,624 | 265 | 184 | 21,362 | ||
| Windsor—Walkerville | Lib | Lib | 12,517 | 53.28% | 5,672 | 24.14% | 63.52% | 3,979 | 12,517 | 6,845 | – | 153 | 23,494 | ||
| York Centre | Lib | Lib | 14,913 | 40.96% | 1,830 | 5.03% | 69.10% | 13,083 | 14,913 | 8,140 | – | 275 | 36,411 | ||
| York North | PC | PC | 12,891 | 39.65% | 2,525 | 7.77% | 68.40% | 12,891 | 10,366 | 9,256 | – | – | 32,513 | ||
| Armourdale | PC | Lib | 14,526 | 43.90% | 2,702 | 8.17% | 68.91% | 11,824 | 14,526 | 6,169 | – | 567 | 33,086 | ||
| Beaches—Woodbine | PC | NDP | 11,462 | 45.58% | 2,886 | 11.48% | 66.65% | 8,576 | 4,914 | 11,462 | – | 195 | 25,147 | ||
| Bellwoods | PC | NDP | 4,935 | 38.38% | 494 | 3.84% | 64.90% | 3,234 | 4,441 | 4,935 | – | 247 | 12,857 | ||
| Don Mills | PC | PC | 14,007 | 46.59% | 5,933 | 19.74% | 60.68% | 14,007 | 7,981 | 8,074 | – | – | 30,062 | ||
| Dovercourt | PC | NDP | 6,083 | 42.10% | 1,465 | 10.14% | 63.87% | 4,618 | 3,174 | 6,083 | 96 | 477 | 14,448 | ||
| Downsview | Lib | NDP | 8,091 | 36.90% | 68 | 0.31% | 65.70% | 5,814 | 8,023 | 8,091 | – | – | 21,928 | ||
| Eglinton | PC | PC | 16,679 | 50.97% | 5,894 | 18.01% | 68.94% | 16,679 | 10,785 | 4,706 | – | 551 | 32,721 | ||
| Etobicoke | Lib | NDP | 9,016 | 37.62% | 1,256 | 5.24% | 67.04% | 7,191 | 7,760 | 9,016 | – | – | 23,967 | ||
| High Park—Swansea | NDP | NDP | 10,172 | 39.84% | 1,844 | 7.22% | 68.77% | 8,328 | 6,540 | 10,172 | – | 493 | 25,533 | ||
| Humber | PC | PC | 17,739 | 44.51% | 3,337 | 8.37% | 71.58% | 17,739 | 14,402 | 7,710 | – | – | 39,851 | ||
| Lakeshore | NDP | NDP | 14,271 | 51.01% | 7,625 | 27.26% | 65.74% | 6,281 | 6,646 | 14,271 | 175 | 602 | 27,975 | ||
| Oakwood | New | NDP | 7,388 | 39.25% | 1,418 | 7.53% | 59.66% | 4,637 | 5,970 | 7,388 | 558 | 271 | 18,824 | ||
| Oriole | New | PC | 12,297 | 38.71% | 239 | 0.75% | 68.00% | 12,297 | 12,058 | 7,413 | – | – | 31,768 | ||
| Parkdale | NDP | NDP | 7,158 | 41.71% | 1,559 | 9.08% | 63.23% | 3,816 | 5,599 | 7,158 | 292 | 298 | 17,163 | ||
| Riverdale | NDP | NDP | 9,133 | 50.27% | 4,268 | 23.49% | 59.48% | 4,865 | 3,754 | 9,133 | 96 | 319 | 18,167 | ||
| St. Andrew—St. Patrick | PC | PC | 8,054 | 36.66% | 429 | 1.95% | 62.57% | 8,054 | 5,951 | 7,625 | – | 339 | 21,969 | ||
| St. David | PC | PC | 10,536 | 40.27% | 2,493 | 9.53% | 66.43% | 10,536 | 7,141 | 8,043 | – | 442 | 26,162 | ||
| St. George | PC | Lib | 11,042 | 42.10% | 2,465 | 9.40% | 60.70% | 8,577 | 11,042 | 6,029 | – | 582 | 26,230 | ||
| Scarborough Centre | PC | PC | 10,399 | 41.15% | 1,037 | 4.10% | 64.13% | 10,399 | 5,042 | 9,362 | – | 469 | 25,272 | ||
| Scarborough East | PC | PC | 12,645 | 42.59% | 3,836 | 12.92% | 66.94% | 12,645 | 8,809 | 7,850 | – | 383 | 29,687 | ||
| Scarborough—Ellesmere | New | NDP | 10,573 | 39.00% | 1,347 | 4.97% | 67.73% | 9,226 | 7,019 | 10,573 | – | 295 | 27,113 | ||
| Scarborough North | PC | PC | 16,512 | 43.41% | 2,677 | 7.04% | 70.03% | 16,512 | 13,835 | 7,241 | – | 447 | 38,035 | ||
| Scarborough West | NDP | NDP | 15,815 | 57.39% | 8,603 | 31.22% | 70.20% | 7,212 | 4,393 | 15,815 | – | 135 | 27,555 | ||
| Wilson Heights | New | Lib | 11,379 | 42.26% | 2,640 | 9.81% | 61.95% | 8,739 | 11,379 | 6,441 | – | 366 | 26,925 | ||
| York East | PC | PC | 14,487 | 47.42% | 5,496 | 17.99% | 66.05% | 14,487 | 8,991 | 5,919 | – | 1,152 | 30,549 | ||
| York Mills | PC | PC | 17,365 | 46.46% | 4,075 | 10.90% | 70.81% | 17,365 | 13,290 | 6,720 | – | – | 37,375 | ||
| York South | NDP | NDP | 13,282 | 48.47% | 6,218 | 22.69% | 67.30% | 7,064 | 6,445 | 13,282 | – | 609 | 27,400 | ||
| York West | PC | PC | 13,871 | 38.70% | 1,356 | 3.78% | 71.33% | 13,871 | 12,515 | 9,454 | – | – | 35,840 | ||
| Yorkview | NDP | NDP | 13,406 | 52.40% | 5,320 | 20.79% | 63.02% | 3,498 | 8,086 | 13,406 | – | 594 | 25,584 | ||
- ↑ including spoilt ballots
- ↑ order is as given in EO reports
- ↑ T. Patrick Reid was elected as a Liberal in 1971
- = open seat
- = turnout is above provincial average
- = winning candidate was in previous Legislature
- = not incumbent; was previously elected to the Legislature
- = incumbent had switched allegiance
- = incumbency arose from byelection gain
- = previously incumbent in another riding
- = Liberal-Labour candidate
- = other incumbents renominated
- = multiple candidates
Analysis
| Party in 1st place | Party in 2nd place | Total | |||
|---|---|---|---|---|---|
| PC | Lib | NDP | |||
| Progressive Conservative | 17 | 34 | 51 | ||
| New Democratic | 20 | 18 | 38 | ||
| Liberal | 30 | 5 | 35 | ||
| Liberal–Labour | 1 | 1 | |||
| Total | 51 | 22 | 52 | 125 | |
| Parties | 1st | 2nd | 3rd | 4th | 5th |
|---|---|---|---|---|---|
| █ Progressive Conservative | 51 | 51 | 23 | ||
| █ New Democratic | 38 | 22 | 65 | ||
| █ Liberal | 35 | 52 | 36 | ||
| █ Liberal–Labour | 1 | 1 | |||
| █ Communist | 26 | 7 | |||
| █ Libertarian | 12 | 3 | |||
| █ Social Credit | 10 | 2 | |||
| █ Independent | 9 | 5 | |||
| █ North American Labour | 2 | 1 |
| Source | Party | |||||
|---|---|---|---|---|---|---|
| PC | NDP | Lib | LL | Total | ||
| Seats retained | Incumbents returned | 34 | 15 | 14 | 63 | |
| Open seats held | 5 | 4 | 2 | 11 | ||
| Held by previous incumbent from other riding | 1 | 1 | ||||
| Incumbent changed to Liberal-Labour | 1 | 1 | ||||
| Seats changing hands | Incumbents defeated | 9 | 7 | 16 | ||
| Open seats gained | 5 | 6 | 11 | |||
| Byelection gain held | 1 | 1 | ||||
| Ouster of third-party byelection gain | 1 | 1 | ||||
| New ridings | New MPPs | 3 | 3 | 3 | 9 | |
| Previously incumbent in other riding | 8 | 1 | 2 | 11 | ||
| Total | 51 | 38 | 35 | 1 | 125 | |
MPPs elected by region and riding
Party designations are as follows:
|
|
|
See also
References
- ↑ The Representation Act, 1975, S.O. 1975, c. 13
- 1 2 3 4 5 6 "1975 general election results". Elections Ontario. Retrieved November 1, 2023.
- ↑ The Election Finances Reform Act, 1975, S.O. 1975, c. 12
- ↑ "125 seats in legislature: Record 454 candidates nominated for 125 Ontario seats". The Globe and Mail. September 5, 1975. p. 40.
- ↑ Williamson, Robert (September 19, 1975). "Elected: PCs, 51; NDP, 38; Lib, 36: AFTER 30 YEARS, TORY MINORITY Lewis will head official Opposition". The Globe and Mail. p. C1.
- ↑ "Leader didn't know: Socreds don't qualify as a party for election". The Globe and Mail. August 14, 1975. p. 4.
Further reading
- Saywell, John, ed. (1976). Canadian Annual Review of Politics and Public Affairs, 1975. Toronto: University of Toronto Press. ISBN 9781442671898.
| General elections | |
|---|---|
| By-elections | |
| Municipal elections | |
| Referendums | |