 | |||||||||||||||||||||||||||||
All 63 seats to Trafford Metropolitan Borough Council 32 seats needed for a majority | |||||||||||||||||||||||||||||
|---|---|---|---|---|---|---|---|---|---|---|---|---|---|---|---|---|---|---|---|---|---|---|---|---|---|---|---|---|---|
| |||||||||||||||||||||||||||||
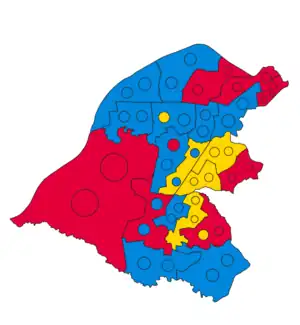 Winner of each seat at the 1973 Trafford Metropolitan Borough Council election | |||||||||||||||||||||||||||||
| |||||||||||||||||||||||||||||
The first elections to Trafford Council were held on Thursday, 10 May 1973. This was a new council created to replace the following authorities: the Municipal Borough of Altrincham, the Municipal Borough of Sale, the Municipal Borough of Stretford, Bowdon Urban District, Hale Urban District, Urmston Urban District, and parts of Bucklow Rural District. This election would create the entire 63-member council (3 councillors to each ward), which would shadow its predecessor councils before taking over their functions on 1 April 1974, as specified in the Local Government Act 1972. Each 1st-placed candidate would serve a five-year term of office, expiring in 1978. Each 2nd-placed candidate would serve a three-year term of office, expiring in 1976. Each 3rd-placed candidate would serve a two-year term of office, expiring in 1975.
The Conservative Party won overall control of the council.[1]
Election result
| Party | Votes | Seats | |||
| Conservative Party | 86,043 (45.0%) | 32 (50.8%) | 32 / 63 | ||
| Labour Party | 63,274 (33.1%) | 19 (30.2%) | 19 / 63 | ||
| Liberal Party | 39,974 (20.9%) | 12 (19.0%) | 12 / 63 | ||
| Communist Party | 1,220 (0.6%) | 0 (0.0%) | 0 / 63 | ||
| Independent | 621 (0.3%) | 0 (0.0%) | 0 / 63 | ||
| 19 | 12 | 32 |
Ward results
No.1 (Altrincham South West)
| Party | Candidate | Votes | % | ±% | |
|---|---|---|---|---|---|
| Labour | George Hoyle* | 1,265 | 53.7 | ||
| Conservative | Kenneth Harrison* | 1,240 | 52.6 | ||
| Conservative | Raymond Littler* | 1,150 | 48.8 | ||
| Conservative | Alan Whitehurst | 1,140 | 48.4 | ||
| Labour | George Harmer* | 1,102 | 46.8 | ||
| Labour | Allan Crossman* | 1,075 | 45.6 | ||
| Communist | J. Brennan | 99 | 4.2 | ||
| Majority | 10 | 0.4 | |||
| Turnout | 2,357 | 36.4 | |||
| Labour win (new seat) | |||||
| Conservative win (new seat) | |||||
| Conservative win (new seat) | |||||
No.2 (Altrincham East)
| Party | Candidate | Votes | % | ±% | |
|---|---|---|---|---|---|
| Liberal | John Davenport* | 1,748 | 43.3 | ||
| Liberal | Michael Farnsworth* | 1,711 | 42.3 | ||
| Liberal | J. R. Richardson* | 1,700 | 42.1 | ||
| Conservative | P. Leigh | 1,504 | 37.3 | ||
| Conservative | P. A. Field | 1,435 | 35.6 | ||
| Conservative | M. J. Brown | 1,397 | 34.6 | ||
| Labour | P. W. Griffiths | 881 | 21.8 | ||
| Labour | R. G. Coulthard | 867 | 21.5 | ||
| Labour | D. N. Teasdale | 859 | 21.3 | ||
| Majority | 196 | 4.9 | |||
| Turnout | 4,034 | 42.2 | |||
| Liberal win (new seat) | |||||
| Liberal win (new seat) | |||||
| Liberal win (new seat) | |||||
No.3 (Altrincham North)
| Party | Candidate | Votes | % | ±% | |
|---|---|---|---|---|---|
| Conservative | F. R. Metcalf* | 1,093 | 35.9 | ||
| Conservative | D. W. Stroud | 1,070 | 35.2 | ||
| Conservative | O. Wilson | 1,054 | 34.6 | ||
| Labour | B. E. Jones | 1,040 | 34.2 | ||
| Liberal | Eric Faulkner* | 1,020 | 33.5 | ||
| Labour | J. Webb* | 974 | 32.0 | ||
| Liberal | Bartholomew Lynch* | 966 | 31.7 | ||
| Labour | M. F. Oliver | 952 | 31.3 | ||
| Liberal | Roy Allen | 833 | 27.4 | ||
| Communist | E. Sheldon | 129 | 4.2 | ||
| Majority | 14 | 0.5 | |||
| Turnout | 3,044 | 45.7 | |||
| Conservative win (new seat) | |||||
| Conservative win (new seat) | |||||
| Conservative win (new seat) | |||||
No.4 (Timperley)
| Party | Candidate | Votes | % | ±% | |
|---|---|---|---|---|---|
| Labour | Harry Wharton* | 1,283 | 38.9 | ||
| Liberal | Raymond Bowker | 1,168 | 35.4 | ||
| Labour | Vincent Collett* | 1,165 | 35.3 | ||
| Conservative | Audrey Weedall* | 1,138 | 34.5 | ||
| Conservative | R. Hall | 1,076 | 32.6 | ||
| Labour | K. Warrington | 1,041 | 31.5 | ||
| Liberal | A. P. Beswick | 1,008 | 30.5 | ||
| Liberal | T. D. Ballard | 999 | 30.3 | ||
| Conservative | R. H. Alcock | 935 | 28.3 | ||
| Communist | L. Whitney | 90 | 2.7 | ||
| Majority | 27 | 0.8 | |||
| Turnout | 3,301 | 43.7 | |||
| Labour win (new seat) | |||||
| Liberal win (new seat) | |||||
| Labour win (new seat) | |||||
No.5 (Mersey-St. Mary’s)
| Party | Candidate | Votes | % | ±% | |
|---|---|---|---|---|---|
| Liberal | Brian Clancy* | 1,876 | 52.8 | ||
| Conservative | Ivor Hurst* | 1,777 | 50.1 | ||
| Conservative | Reginald Bannister* | 1,774 | 50.0 | ||
| Liberal | Kenneth Humber* | 1,752 | 49.4 | ||
| Liberal | M. H. Hughes | 1,736 | 48.9 | ||
| Conservative | J. M. Parkins* | 1,734 | 48.8 | ||
| Majority | 22 | 0.6 | |||
| Turnout | 3,550 | 39.9 | |||
| Liberal win (new seat) | |||||
| Conservative win (new seat) | |||||
| Conservative win (new seat) | |||||
No.6 (St. Martin’s)
| Party | Candidate | Votes | % | ±% | |
|---|---|---|---|---|---|
| Conservative | Michael King | 2,178 | 55.6 | ||
| Labour | William Munro* | 2,137 | 54.6 | ||
| Conservative | Stanley Brownhill* | 2,029 | 51.8 | ||
| Conservative | G. M. Rubenstein | 1,832 | 46.8 | ||
| Labour | Eric Mellor* | 1,800 | 46.0 | ||
| Labour | G. Naggs | 1,770 | 45.2 | ||
| Majority | 197 | 5.0 | |||
| Turnout | 3,915 | 37.0 | |||
| Conservative win (new seat) | |||||
| Labour win (new seat) | |||||
| Conservative win (new seat) | |||||
No.7 (Sale Moor)
| Party | Candidate | Votes | % | ±% | |
|---|---|---|---|---|---|
| Labour | Richard Mee* | 1,345 | 57.2 | ||
| Labour | Winifred Phillips | 1,344 | 57.2 | ||
| Labour | Barry Brotherton* | 1,197 | 50.9 | ||
| Conservative | J. J. Hammond | 1,043 | 44.4 | ||
| Conservative | E. Scarborough | 1,028 | 43.7 | ||
| Conservative | G. M. de Berry | 987 | 42.0 | ||
| Communist | A. H. Burrage | 110 | 4.7 | ||
| Majority | 154 | 6.6 | |||
| Turnout | 2,351 | 35.1 | |||
| Labour win (new seat) | |||||
| Labour win (new seat) | |||||
| Labour win (new seat) | |||||
No.8 (St. Anne’s)
| Party | Candidate | Votes | % | ±% | |
|---|---|---|---|---|---|
| Liberal | John Phillipson* | 1,605 | 42.7 | ||
| Liberal | John Golding* | 1,529 | 40.7 | ||
| Liberal | A. Thorpe | 1,475 | 39.2 | ||
| Conservative | J. E. Peet | 1,435 | 38.2 | ||
| Conservative | Frank Seddon-Laughton* | 1,417 | 37.7 | ||
| Conservative | John Sutton | 1,349 | 35.9 | ||
| Labour | K. Walton | 856 | 22.8 | ||
| Labour | K. J. Tottle | 806 | 21.4 | ||
| Labour | T. J. Packham | 705 | 18.8 | ||
| Communist | D. A. Hames | 102 | 2.7 | ||
| Majority | 40 | 1.1 | |||
| Turnout | 3,760 | 44.1 | |||
| Liberal win (new seat) | |||||
| Liberal win (new seat) | |||||
| Liberal win (new seat) | |||||
No.9 (Brooklands)
| Party | Candidate | Votes | % | ±% | |
|---|---|---|---|---|---|
| Liberal | Cecil Fink* | 2,073 | 54.0 | ||
| Liberal | M. Horlock* | 2,027 | 52.8 | ||
| Liberal | S. Evans | 1,905 | 49.6 | ||
| Conservative | George Goodliffe* | 1,878 | 48.9 | ||
| Conservative | J. L. Fergusson* | 1,796 | 46.8 | ||
| Conservative | A. S. Long* | 1,723 | 44.9 | ||
| Communist | B. Panter | 120 | 3.1 | ||
| Majority | 27 | 0.7 | |||
| Turnout | 3,841 | 43.4 | |||
| Liberal win (new seat) | |||||
| Liberal win (new seat) | |||||
| Liberal win (new seat) | |||||
No.10 (Talbot North)
| Party | Candidate | Votes | % | ±% | |
|---|---|---|---|---|---|
| Labour | George Marland* | 1,755 | 65.3 | ||
| Labour | Daniel Sullivan* | 1,715 | 63.8 | ||
| Labour | Clifford Cronshaw* | 1,694 | 63.1 | ||
| Conservative | John Schofield* | 956 | 35.6 | ||
| Conservative | Florence Warbrick | 905 | 33.7 | ||
| Conservative | G. D. Miles | 843 | 31.4 | ||
| Communist | A. Ironmonger | 190 | 7.1 | ||
| Majority | 738 | 27.5 | |||
| Turnout | 2,686 | 30.1 | |||
| Labour win (new seat) | |||||
| Labour win (new seat) | |||||
| Labour win (new seat) | |||||
No.11 (Clifford)
| Party | Candidate | Votes | % | ±% | |
|---|---|---|---|---|---|
| Labour | H. Davies | 1,445 | 58.0 | ||
| Labour | V. J. Wynne | 1,346 | 54.0 | ||
| Labour | Raymond Tully | 1,295 | 52.0 | ||
| Conservative | Roy Corke | 1,169 | 46.9 | ||
| Conservative | Edward Kelson | 1,123 | 45.1 | ||
| Conservative | K. J. Pulford | 1,095 | 44.0 | ||
| Majority | 126 | 5.1 | |||
| Turnout | 2,491 | 36.9 | |||
| Labour win (new seat) | |||||
| Labour win (new seat) | |||||
| Labour win (new seat) | |||||
No.12 (Longford)
| Party | Candidate | Votes | % | ±% | |
|---|---|---|---|---|---|
| Conservative | David Homer* | 1,859 | 54.0 | ||
| Conservative | Olive Chandler* | 1,811 | 52.6 | ||
| Conservative | Alexander Kelly | 1,711 | 49.7 | ||
| Labour | Joan Bailey | 1,683 | 48.9 | ||
| Labour | H. Pyper | 1,655 | 48.1 | ||
| Labour | K. Silcock | 1,606 | 46.7 | ||
| Majority | 28 | 0.8 | |||
| Turnout | 3,442 | 35.4 | |||
| Conservative win (new seat) | |||||
| Conservative win (new seat) | |||||
| Conservative win (new seat) | |||||
No.13 (Stretford)
| Party | Candidate | Votes | % | ±% | |
|---|---|---|---|---|---|
| Conservative | Margaret Hindley* | 1,583 | 68.7 | ||
| Conservative | Colin Warbrick* | 1,493 | 64.8 | ||
| Conservative | Harry Walker | 1,492 | 64.8 | ||
| Labour | E. P. Wollaston | 789 | 34.3 | ||
| Labour | Irene Gregory | 777 | 33.7 | ||
| Labour | J. R. Haydock | 777 | 33.7 | ||
| Majority | 703 | 30.5 | |||
| Turnout | 2,303 | 39.0 | |||
| Conservative win (new seat) | |||||
| Conservative win (new seat) | |||||
| Conservative win (new seat) | |||||
No.14 (Park)
| Party | Candidate | Votes | % | ±% | |
|---|---|---|---|---|---|
| Labour | J. Shaw | 1,530 | 62.2 | ||
| Labour | Herbert Pyper* | 1,503 | 61.1 | ||
| Labour | James Haydock | 1,484 | 60.3 | ||
| Conservative | W. Matthews | 936 | 38.0 | ||
| Conservative | Evans | 886 | 36.0 | ||
| Conservative | Jaminson | 860 | 35.0 | ||
| Communist | Jarrett | 181 | 7.4 | ||
| Majority | 548 | 22.3 | |||
| Turnout | 2,460 | 39.2 | |||
| Labour win (new seat) | |||||
| Labour win (new seat) | |||||
| Labour win (new seat) | |||||
No.15 (Bowdon)
| Party | Candidate | Votes | % | ±% | |
|---|---|---|---|---|---|
| Conservative | Jean Gill* | 2,442 | 73.4 | ||
| Conservative | Barbara Sutton Hall* | 2,332 | 70.1 | ||
| Conservative | John Humphreys* | 2,262 | 68.0 | ||
| Liberal | F. V. Vickery* | 1,213 | 36.5 | ||
| Labour | A. D. Johnson* | 702 | 21.1 | ||
| Labour | J. R. Kill | 543 | 16.3 | ||
| Labour | A. R. Duxbury | 487 | 14.6 | ||
| Majority | 1,049 | 31.5 | |||
| Turnout | 3,327 | 47.2 | |||
| Conservative win (new seat) | |||||
| Conservative win (new seat) | |||||
| Conservative win (new seat) | |||||
No.16 (Hale)
| Party | Candidate | Votes | % | ±% | |
|---|---|---|---|---|---|
| Conservative | Marjorie Hinchcliffe* | 2,814 | 68.0 | ||
| Conservative | B. H. Adams | 2,734 | 66.0 | ||
| Conservative | Roy Godwin* | 2,726 | 65.8 | ||
| Liberal | Constance Ball* | 1,016 | 24.5 | ||
| Liberal | Bernadette Judson | 941 | 22.7 | ||
| Liberal | Rosemarie Rivera | 897 | 21.7 | ||
| Labour | Joyce Cope | 508 | 12.3 | ||
| Labour | E. S. Donnelly | 407 | 9.8 | ||
| Labour | M. P. Green | 379 | 9.2 | ||
| Majority | 1,710 | 41.3 | |||
| Turnout | 4,140 | 44.9 | |||
| Conservative win (new seat) | |||||
| Conservative win (new seat) | |||||
| Conservative win (new seat) | |||||
No.17 (Partington)
| Party | Candidate | Votes | % | ±% | |
|---|---|---|---|---|---|
| Labour | Frank Holland* | 1,277 | 74.2 | ||
| Labour | John Paul* | 1,228 | 71.3 | ||
| Labour | Brian Nutter* | 1,151 | 66.8 | ||
| Liberal | A. Appleton* | 690 | 40.1 | ||
| Independent | Mark Sharkey* | 621 | 36.1 | ||
| Communist | E. Wilkinson | 199 | 11.6 | ||
| Majority | 461 | 26.8 | |||
| Turnout | 1,722 | 24.0 | |||
| Labour win (new seat) | |||||
| Labour win (new seat) | |||||
| Labour win (new seat) | |||||
No.18 (Urmston West East)
| Party | Candidate | Votes | % | ±% | |
|---|---|---|---|---|---|
| Conservative | Allan Coupe* | 1,323 | 40.2 | ||
| Conservative | Ruth Royle-Higginson* | 1,270 | 38.6 | ||
| Liberal | Gwen Davies | 1,262 | 38.3 | ||
| Liberal | J. Tame | 1,261 | 38.3 | ||
| Conservative | Anthony Platt* | 1,208 | 36.7 | ||
| Liberal | A. Dickinson | 1,169 | 35.5 | ||
| Labour | D. O'Kelly* | 849 | 25.8 | ||
| Labour | D. Watts | 772 | 23.4 | ||
| Labour | W. Williams | 769 | 23.3 | ||
| Majority | 1 | 0.0 | |||
| Turnout | 3,294 | 39.3 | |||
| Conservative win (new seat) | |||||
| Conservative win (new seat) | |||||
| Liberal win (new seat) | |||||
No.19 (Flixton East Central)
| Party | Candidate | Votes | % | ±% | |
|---|---|---|---|---|---|
| Conservative | William Wroe* | 1,877 | 47.4 | ||
| Conservative | Neil Fitzpatrick | 1,755 | 44.3 | ||
| Conservative | Gordon Lumby | 1,737 | 43.9 | ||
| Liberal | Norman Heywood | 1,539 | 38.9 | ||
| Liberal | Margaret Willis | 1,431 | 36.2 | ||
| Liberal | A. Hannett | 1,415 | 35.8 | ||
| Labour | D. M. Hall | 735 | 18.6 | ||
| Labour | R. P. Phillips | 727 | 18.4 | ||
| Labour | Kathleen Barnes | 658 | 16.6 | ||
| Majority | 198 | 5.0 | |||
| Turnout | 3,958 | 43.1 | |||
| Conservative win (new seat) | |||||
| Conservative win (new seat) | |||||
| Conservative win (new seat) | |||||
No.20 (Flixton West)
| Party | Candidate | Votes | % | ±% | |
|---|---|---|---|---|---|
| Conservative | George Carnall* | 1,964 | 56.5 | ||
| Conservative | Albert Williams | 1,908 | 54.9 | ||
| Conservative | H. P. Liddiard | 1,897 | 54.6 | ||
| Labour | B. Elliot | 1,636 | 47.1 | ||
| Labour | A. Stringer* | 1,538 | 44.2 | ||
| Labour | R. Taylor | 1,479 | 42.5 | ||
| Majority | 261 | 7.5 | |||
| Turnout | 3,476 | 37.6 | |||
| Conservative win (new seat) | |||||
| Conservative win (new seat) | |||||
| Conservative win (new seat) | |||||
No.21 (Davyhulme East)
| Party | Candidate | Votes | % | ±% | |
|---|---|---|---|---|---|
| Conservative | Raymond Haigh* | 1,158 | 64.4 | ||
| Conservative | Frank Eadie* | 1,148 | 63.8 | ||
| Conservative | Eric Crosbie | 1,122 | 62.4 | ||
| Labour | B. Hall | 678 | 37.7 | ||
| Labour | D. Stewart | 658 | 36.6 | ||
| Labour | G. Scott | 629 | 35.0 | ||
| Majority | 444 | 24.7 | |||
| Turnout | 1,798 | 33.2 | |||
| Conservative win (new seat) | |||||
| Conservative win (new seat) | |||||
| Conservative win (new seat) | |||||
By-elections between 1973 and 1975
| Party | Candidate | Votes | % | ±% | |
|---|---|---|---|---|---|
| Conservative | Peter Morgan Evans | 1,752 | 46.2 | -13.8 | |
| Labour | T. J. Packham | 1,191 | 31.4 | ||
| Liberal | M. Wood | 849 | 22.4 | ||
| Majority | 561 | 14.8 | |||
| Turnout | 3,792 | 34.0 | |||
| Conservative gain from Labour | Swing | ||||
References
- ↑ "Trafford M. B. C. Election Results Sheet, 11 May 1973", Trafford M.B.C.(1973).
| County councils (England) |
|
|---|---|
| County councils (Wales) |
|
| County councils (Scotland) |
|
| Unicameral area | |
| Metropolitan boroughs |
|
| City corporations | |
| District councils (England) |
|
| District councils (Wales) |
|
| District councils (Northern Ireland) | |
| Town councils |
|
| Sui generis |
|