- This essay is on Wikiversity to encourage a wide discussion of the issues it raises moderated by the Wikimedia rules that invite contributors to “be bold but not reckless,” contributing revisions written from a neutral point of view citing credible sources -- and raising other questions and concerns on the associated '“Discuss”' page.
The mainstream commercial media have a conflict of interest in disseminating any substantive information about anything that might offend a major advertiser.
Why? Because media organizations everywhere sell changes in the behaviors of their audience to their funders. If they don't have an audience, they won't have funding for long. If the audience does not change its behaviors -- or worse, if the audience changes behaviors in ways that funders don't like -- the funders will look for other ways to use that money.
Mainstream commercial media organizations in the United States compete for audience with content that does not offend the major advertisers, and they compete for advertising on the characteristics of their audience. In the United States, advertising rates with the mainstream commercial media are set based on audience size and purchasing patterns.
News reports that libel or slander poor people are easy and cheap to produce, because poor people have so far not found any effective way to retaliate: They can't afford attorneys' fees and court costs, and they have so far not been sufficiently well organized to turn off media channels that portray them in a negative light.
By contrast, it is extremely expensive to produce news stories that might offend a major advertiser. Few organizations bite the hands that feed them. Occasionally but rarely, publication of a story that offends an advertiser is accompanied by a sufficient increase in or retention of audience to offset a possible loss of advertising. The Deepwater Horizon oil spill in 2010 was too big to cover up. In addition, it attracted sufficient public interest that a major media outlet could have expected a substantial loss in audience from not covering it.
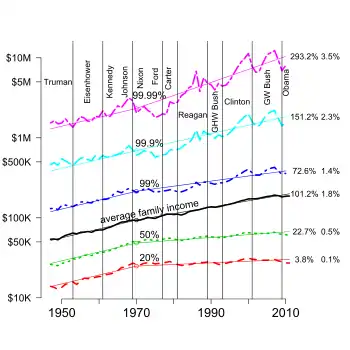
Estimates of the cost of political corruption in the US have ranged from $100 billion per year[1] ($1,200 per family per year) to $39,000 per family per year (over $100 per day).[2] The latter number corresponds to the increase in the difference between the mean (numerical average) and the median (middle value) annual family income in the US, shown in the accompanying figure. This figure shows that the average family income has grown at close to a constant 2 percent per year for this entire period. The median grew at essentially that rate from 1947 to about 1970 and has been relatively flat since then.[3]
One suggestion of this article is that the funding structure of the media may have contributed to this growth in income inequality, and more democratic control of media funding could lead to both increased economic growth and greater equity in the distribution of income in the US.
Media reformers have suggested that government agencies match what they spend on accounting with democratically-controlled subsidies of investigative journalism. This could be done in proportion to qualified Internet clicks from people in a given local jurisdiction. This subsidy would roughly match the percent of the nation's economy that the new United States devoted to subsidizing newspapers under US Postal Service Act of 1792: At a time when first class postage was between 6 and 25 cents depending on distance, newspapers were delivered up to 100 miles for a penny and beyond that for 1.5 cents. This subsidy amounted to roughly two tenths of a percent of the US economy (Gross Domestic Product (GDP). Any place where government is 20 percent of the economy and accounting is one percent of government spends 0.2 percent of that economy on governmental accounting.
One might argue that it's more important to ensure that the right beans are counted than it is to count the beans accurately.[7] For more on this, see the Wikiversity article on "media and corruption" and the prospectus for endowmentforjournalism
See also
Notes
- ↑ DeHaven, Tad (2014-07-01), Corporate Welfare in the Federal Budget, Policy Analysis, Cato Institute, retrieved 2014-09-01
- ↑ See also Wikiversity, "Media and corruption".
- ↑ A more careful analysis revealed that the average income grew at 2.2 percent per year between 1947 and 1970 and 1.8 percent since. That was true for the median as well until around 1970. Since then the median has grown at only about 0.5 percent per year.
- ↑ "Table F-1. Income Limits for Each Fifth and Top 5 Percent of Families (All Races): 1947 to 2010", Current Population Survey, Annual Social and Economic Supplements, United States Census Bureau, retrieved 2012-01-24 Note: median computed as the geometric mean of the 20th and 40th percentiles
- ↑ Piketty, Thomas; Saez, Emmanuel, Atkinson, A. B.; Piketty, Thomas (eds.), Income Inequality in the United States, 1913-2002, retrieved 2012-02-08
- ↑ The differences between the Census and Internal Revenue Service Data can be seen most easily in the 95th percentile, present in both data sets. For more details see the help file for the "incomeInequality" data in the Ecdat package available from the Comprehensive R Archive Network (CRAN; see r-project.org).
- ↑ We account for expenses to the last penny, but the accounting for results rarely get more than lip service. Graves, Spencer (1995). "Common principles of quality management and development economics". Quality Management Journal: 65-79.
- ↑ Endowment for Journalism, retrieved 2016-12-21