< Page:Calculus Made Easy.pdf
This page has been proofread, but needs to be validated.
SINES AND COSINES
167
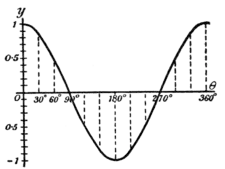
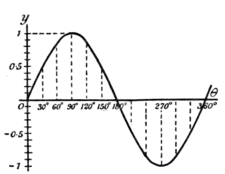
The accompanying curves, Fig. 44 and Fig. 45, show, plotted to scale, the values of , and , for the corresponding values of .


Fig. 44.
Fig. 45.
This article is issued from Wikisource. The text is licensed under Creative Commons - Attribution - Sharealike. Additional terms may apply for the media files.