Intibucá
Intibucá (Spanish pronunciation: [intiˈβuka]) is a city, with a population of 28,220 (2023 calculation),[3] and a municipality in the department of Intibucá, Honduras. The urban area of Intibucá is an important transit and commercial site in the South-West region of Honduras.
Intibucá
La ciudad del manto blanco | |
|---|---|
Municipality | |
_con_sus_maravillas_naturales_y_tradiciones_lencas.jpg.webp) | |
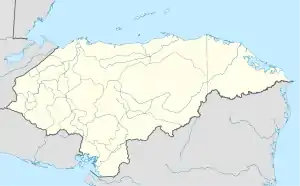
 Intibucá Location of Intibucá in Honduras | |
| Coordinates: 14°19′24.37″N 88°11′5.31″W | |
| Country | Honduras |
| Department | Intibucá |
| Head of parish | 1791 |
| Municipality of Gracias | 1866 |
| Municipality of Intibuca | 1883 |
| Government | |
| • Type | Democratic Municipality |
| • Mayor | Javier Eusebio Martínez Ramos (PNH)[1] |
| Area | |
| • Total | 531 km2 (205 sq mi) |
| Elevation | 1,700 m (5,600 ft) |
| Population (2023 projection)[2] | |
| • Total | 70,092 |
| • Density | 130/km2 (340/sq mi) |
| Time zone | UTC-6 (Central America) |
| Postal code | 14000 |
| Municipality number | 1006 |
| Climate | Cwb |
Climate
Intibucá and La Esperanza have a subtropical highland climate (Köppen: Cwb), It is characterized by having pleasant temperatures, even cold by Honduran measures. The annual difference between the coldest month (December) and the warmest month (April) is 5 °C. The climate is favorable for the cultivation of potatoes, strawberries, blackberries, peaches, and vegetables in general.
| Climate data for Intibucá (Honduras) 1.700 – 2.200 msnm | |||||||||||||
|---|---|---|---|---|---|---|---|---|---|---|---|---|---|
| Month | Jan | Feb | Mar | Apr | May | Jun | Jul | Aug | Sep | Oct | Nov | Dec | Year |
| Record high °F (°C) | 78.6 (25.9) |
84.0 (28.9) |
89.4 (31.9) |
91.0 (32.8) |
88.3 (31.3) |
86.0 (30.0) |
88.2 (31.2) |
90.1 (32.3) |
87.3 (30.7) |
82.8 (28.2) |
82.2 (27.9) |
79.2 (26.2) |
91.0 (32.8) |
| Average high °F (°C) | 66.7 (19.3) |
69.4 (20.8) |
74.1 (23.4) |
76.8 (24.9) |
77.9 (25.5) |
75.0 (23.9) |
71.6 (22.0) |
71.6 (22.0) |
70.9 (21.6) |
70.3 (21.3) |
68.0 (20.0) |
67.1 (19.5) |
71.6 (22.0) |
| Daily mean °F (°C) | 61.0 (16.1) |
62.4 (16.9) |
62.2 (16.8) |
64.4 (18.0) |
65.8 (18.8) |
67.6 (19.8) |
64.9 (18.3) |
63.3 (17.4) |
62.8 (17.1) |
62.8 (17.1) |
64.0 (17.8) |
62.6 (17.0) |
63.7 (17.6) |
| Average low °F (°C) | 47.5 (8.6) |
47.7 (8.7) |
50.5 (10.3) |
53.1 (11.7) |
54.9 (12.7) |
57.0 (13.9) |
57.2 (14.0) |
55.0 (12.8) |
54.9 (12.7) |
55.4 (13.0) |
52.2 (11.2) |
47.7 (8.7) |
52.8 (11.5) |
| Record low °F (°C) | 25.0 (−3.9) |
30.0 (−1.1) |
31.8 (−0.1) |
40.8 (4.9) |
44.1 (6.7) |
47.8 (8.8) |
48.2 (9.0) |
48.0 (8.9) |
45.9 (7.7) |
37.8 (3.2) |
32.4 (0.2) |
28.4 (−2.0) |
25.0 (−3.9) |
| Average precipitation inches (mm) | 0.4 (10) |
0.4 (10) |
0.8 (20) |
2.2 (57) |
2.7 (69) |
7.1 (180) |
5.6 (143) |
5.2 (131) |
4.6 (116) |
4.2 (107) |
2.0 (52) |
0.8 (20) |
36 (915) |
| Average rainy days (≥ 0.1 mm) | 14 | 3 | 5 | 16 | 16 | 24 | 22 | 23 | 25 | 16 | 16 | 15 | 195 |
| Average relative humidity (%) | 65 | 66 | 60 | 69 | 74 | 78 | 83 | 84 | 85 | 90 | 76 | 69 | 75 |
| Source: Climate-data.org(http://es.climate-data.org/location/46747/) | |||||||||||||
References
- AMHON: Asociación de Municipios de Honduras. "Alcaldes y Alcaldesas" [Mayors and Municipalities] (in Spanish). Archived from the original on 2 October 2015. Retrieved 13 February 2016.
- Citypopulation.de Population of departments and municipalities in Honduras
- Citypopulation.de Population of cities in Honduras
This article is issued from Wikipedia. The text is licensed under Creative Commons - Attribution - Sharealike. Additional terms may apply for the media files.