Chart
A chart or graph is an image which summarizes data and presents it in an easy to understand way. Charts are often used to make it easier to understand the relationships of different aspects of the data. It is easier to read a chart than the raw data.
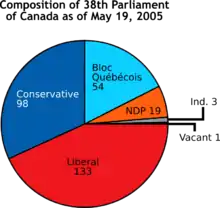
A pie chart.
Types of charts
- A bar chart uses bars to show values for different categories.
- A pie chart shows percentage values as a slice of a pie.
- A flow chart shows the separate steps of a process.
This article is issued from Wikipedia. The text is licensed under Creative Commons - Attribution - Sharealike. Additional terms may apply for the media files.