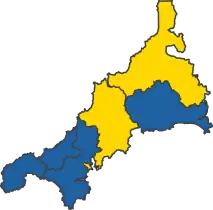
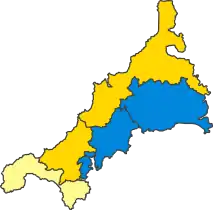
The ceremonial county of Cornwall, which includes the Isles of Scilly, is divided into six parliamentary constituencies. They are all county constituencies.
Parliamentary history of Cornwall
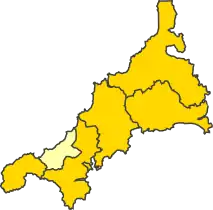
All six parliamentary seats are currently held by Conservatives, having came from holding no seats in 1997, 2001 and 2005, to gaining three of the six from the Liberal Democrats in 2010, to gaining the remaining three to hold all six Cornish seats in 2015. All six MPs were re-elected in 2017. In that election, several previous Liberal Democrat candidates, including previous MPs Andrew George and Steve Gilbert re-stood in their old seats, but failed to be re-elected. In all six seats, the Labour vote surged, pushing the Liberals into third place in four of the six seats. In the 2019 election, Labour retained their position as the second-placed party in most of the Cornish seats, holding their vote up far better in the region than elsewhere in the country. The last Labour MP for a Cornish constituency was Candy Atherton, who held the seat of Falmouth and Camborne between 1997 and 2005.
Constituencies
Conservative † Labour ‡ Liberal Democrat ¤
| Constituency | Electorate[1] | Majority[2][nb 1] | Member of Parliament[2] | Nearest opposition[2] | Current electoral wards[3][4] | Original electoral wards[5][6] | Map | ||
|---|---|---|---|---|---|---|---|---|---|
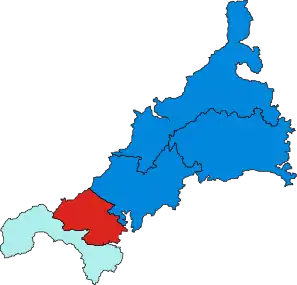
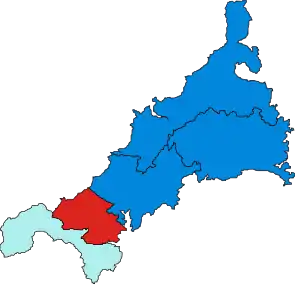
| Camborne and Redruth | 70,250 | 8,700 | George Eustice † | Paul Farmer ‡ |
|
|
 | ||
| North Cornwall | 69,935 | 14,752 | Scott Mann † | Danny Chambers ¤ |
|
|
 | ||
| South East Cornwall | 71,825 | 20,971 | Sheryll Murray † | Gareth Derrick ‡ |
|
|
 | ||
| St Austell and Newquay | 79,930 | 16,526 | Steve Double † | Felicity Owen ‡ |
|
|
 | ||
| St Ives | 68,795 | 4,284 | Derek Thomas † | Andrew George ¤ |
Isles of Scilly |
|
 | ||
| Truro and Falmouth | 76,719 | 4,561 | Cherilyn Mackrory † | Jennifer Forbes ‡ |
|
|
 | ||
2010 boundary review
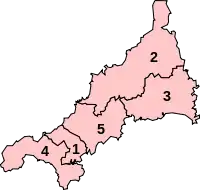
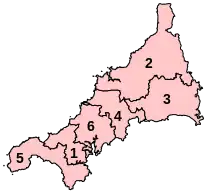
Under the Fifth Periodic Review of Westminster constituencies, the Boundary Commission for England decided to increase the number of seats which covered Cornwall from 5 to 6. Falmouth and Camborne, and Truro and St Austell were abolished and replaced by Camborne and Redruth, St Austell and Newquay, and Truro and Falmouth.
| Former name | Boundaries 1997–2010 | Current name | Boundaries 2010–present |
|---|---|---|---|
 Parliamentary constituencies in Cornwall |
 Proposed Revised constituencies in Cornwall | ||
Proposed boundary changes
See 2023 Periodic Review of Westminster constituencies for further details.
Following the abandonment of the Sixth Periodic Review (the 2018 review), the Boundary Commission for England formally launched the 2023 Review on 5 January 2021.[7] Initial proposals were published on 8 June 2021 and, following two periods of public consultation, revised proposals were published on 8 November 2022. The final recommendations were submitted to the Speaker of the House of Commons and then published on 28 June 2023.
When the final recommendations come into effect at the next general election, the six existing parliamentary constituencies in Cornwall are to be retained with the same names and relatively minor alterations compared to other parts of the country.[8]
Results history
Primary data source: House of Commons research briefing – General election results from 1918 to 2019[9]
Vote breakdown
| Year | Conservative | Labour | Liberal Democrats | Green | UKIP | Mebyon Kernow | Others | Notes | |||||||||||||
|---|---|---|---|---|---|---|---|---|---|---|---|---|---|---|---|---|---|---|---|---|---|
| Votes | % | -/+ | Votes | % | -/+ | Votes | % | -/+ | Votes | % | -/+ | Votes | % | -/+ | Votes | % | -/+ | Votes | % | ||
| 2019 | 173,027 | 53.8 | +5.4 | 74,392 | 23.1 | -3.6 | 62,165 | 19.3 | -4.2 | 7,129 | 2.2 | +1.1 | did not contest | 1,660 | 0.5 | +0.5 | 3,602 | 1.1 | |||
| 2017 | 152,428 | 48.4 | +5.3 | 83,968 | 26.7 | +14.4 | 73,875 | 23.5 | +1.1 | 3,218 | 1.0 | -4.8 | 897 | 0.3 | -13.5 | did not contest | 323 | 0.1 | |||
| 2015 | 127,079 | 43.1 | +2.2 | 36,235 | 12.3 | +3.7 | 66,056 | 22.4 | -19.4 | 17,241 | 5.8 | +4.5 | 40,785 | 13.8 | +8.9 | 5,675 | 1.9 | 1,757 | 0.6 | ||
| 2010 | 115,016 | 40.9 | +9.1 | 24,257 | 8.6 | -7.0 | 117,307 | 41.8 | -2.6 | 3,573 | 1.3 | +0.6 | 13,763 | 4.9 | -0.1 | 5,379 | 1.9 | +0.5 | 1,586 | 0.6 | |
| 2005 | 82,543 | 31.8 | -0.8 | 41,140 | 15.6 | -1.7 | 115,241 | 44.4 | -0.4 | 1,738 | 0.7 | +0.7 | 12,863 | 5.0 | +1.3 | 3,552 | 1.4 | +0.1 | 2,356 | 0.9 | |
| 2001 | 82,227 | 32.6 | +2.2 | 43,674 | 17.3 | +0.2 | 113,000 | 44.8 | +0.9 | did not contest | 9,290 | 3.7 | +2.7 | 3,199 | 1.3 | +0.6 | 727 | 0.3 | |||
| 1997 | 85,077 | 30.4 | -12.3 | 47,913 | 17.1 | +3.2 | 123,124 | 43.9 | +2.2 | 482 | 0.2 | -0.1 | 2,926 | 1.0 | +1.0 | 1,906 | 0.7 | +0.7 | 18,779 | 6.7 | |
| 1992 | 127,678 | 42.7 | -4.6 | 41,593 | 13.9 | +1.3 | 124,553 | 41.7 | +1.7 | 1,035 | 0.3 | +0.3 | did not exist | did not contest | 4,098 | 1.4 | |||||
| 1987 | 131,194 | 47.3 | -2.0 | 34,994 | 12.6 | +3.7 | 111,064 | 40.0 | -0.8 | did not contest | did not contest | 373 | 0.1 | ||||||||
| 1983 | 126,182 | 49.3 | -1.3 | 22,838 | 8.9 | -3.7 | 104,365 | 40.8 | +6.6 | 776 | 0.3 | -0.2 | 1,151 | 0.5 | -1.1 | 677 | 0.3 | ||||
Percentage votes
| Election year | 1923 | 1924 | 1929 | 1945 | 1950 | 1951 | 1955 | 1959 | 1964 | 1966 | 1970 | 1974
(Feb) |
1974
(Oct) |
1979 | 1983 | 1987 | 1992 | 1997 | 2001 | 2005 | 2010 | 2015 | 2017 | 2019 |
|---|---|---|---|---|---|---|---|---|---|---|---|---|---|---|---|---|---|---|---|---|---|---|---|---|
| Conservative1 | 35.0 | 48.6 | 38.4 | 42.0 | 44.2 | 50.5 | 48.5 | 43.8 | 41.1 | 41.1 | 47.9 | 41.8 | 43.6 | 50.6 | 49.3 | 47.3 | 42.7 | 30.4 | 32.6 | 31.8 | 40.9 | 43.1 | 48.4 | 53.8 |
| Labour | 2.3 | 9.7 | 18.1 | 25.4 | 29.6 | 33.3 | 30.7 | 27.5 | 25.9 | 27.6 | 24.6 | 19.6 | 20.0 | 12.6 | 8.9 | 12.6 | 13.9 | 17.1 | 17.3 | 15.9 | 8.6 | 12.3 | 26.7 | 23.1 |
| Liberal Democrat2 | 52.6 | 41.7 | 42.4 | 32.6 | 26.2 | 16.2 | 20.8 | 28.7 | 32.8 | 30.6 | 27.0 | 38.2 | 35.2 | 34.2 | 40.8 | 40.0 | 41.7 | 44.0 | 44.8 | 44.4 | 41.8 | 22.4 | 23.5 | 19.3 |
| Green Party | – | – | – | – | – | – | – | – | – | – | – | – | – | – | – | * | * | * | * | * | 1.3 | 5.8 | 1.0 | 2.2 |
| UKIP | – | – | – | – | – | – | – | – | – | – | – | – | – | – | – | – | – | * | * | * | 4.9 | 13.8 | 0.3 | – |
| Other | 10.0 | – | 1.2 | 0.4 | – | – | – | – | 0.1 | 0.7 | 0.4 | 0.4 | 1.2 | 2.6 | 1.0 | 0.1 | 1.7 | 8.6 | 5.2 | 7.9 | 2.5 | 2.5 | 0.1 | 1.6 |
1Includes Constitutionalist in 1924 and National Liberal Party up to 1966
21950–1979 – Liberal; 1983 & 1987 – SDP-Liberal Alliance
* Included in Other
Meaningful vote percentages are not applicable for the elections of 1918, 1922, 1931 and 1935 since one or more seats were gained unopposed.
Seats
| Election year | 1918 | 1922 | 1923 | 1924 | 1929 | 1931 | 1935 | 1945 | 1950 | 1951 | 1955 | 1959 | 1964 | 1966 | 1970 | 1974
(Feb) |
1974
(Oct) |
1979 | 1983 | 1987 | 1992 | 1997 | 2001 | 2005 | 2010 | 2015 | 2017 | 2019 |
|---|---|---|---|---|---|---|---|---|---|---|---|---|---|---|---|---|---|---|---|---|---|---|---|---|---|---|---|---|
| Conservative1 | 2 | 2 | 0 | 5 | 0 | 3 | 4 | 3 | 4 | 4 | 4 | 4 | 3 | 2 | 4 | 3 | 3 | 4 | 4 | 4 | 3 | 0 | 0 | 0 | 3 | 6 | 6 | 6 |
| Labour | 0 | 0 | 0 | 0 | 0 | 0 | 0 | 1 | 1 | 1 | 1 | 1 | 1 | 1 | 0 | 0 | 0 | 0 | 0 | 0 | 0 | 1 | 1 | 0 | 0 | 0 | 0 | 0 |
| Liberal Democrat2 | 2 | 1 | 4 | 0 | 5 | 2 | 1 | 1 | 0 | 0 | 0 | 0 | 1 | 2 | 1 | 2 | 2 | 1 | 1 | 1 | 2 | 4 | 4 | 5 | 3 | 0 | 0 | 0 |
| National Liberal | 1 | 2 | 0 | 0 | 0 | 0 | 0 | 0 | 0 | 0 | 0 | 0 | 0 | 0 | 0 | 0 | 0 | 0 | 0 | 0 | 0 | 0 | 0 | 0 | 0 | 0 | 0 | 0 |
| Independent Liberal | 0 | 0 | 1 | 0 | 0 | 0 | 0 | 0 | 0 | 0 | 0 | 0 | 0 | 0 | 0 | 0 | 0 | 0 | 0 | 0 | 0 | 0 | 0 | 0 | 0 | 0 | 0 | 0 |
| Total | 5 | 5 | 5 | 5 | 5 | 5 | 5 | 5 | 5 | 5 | 5 | 5 | 5 | 5 | 5 | 5 | 5 | 5 | 5 | 5 | 5 | 5 | 5 | 5 | 6 | 6 | 6 | 6 |
1Includes Constitutionalist in 1924 and National Liberal Party up to 1966
2pre-1979 – Liberal; 1983 & 1987 – SDP-Liberal Alliance
Maps
1885–1910
 1885
1885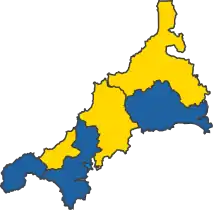 1886
1886- 1892
 1895
1895 1900
1900 1906
1906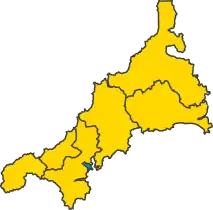 Jan 1910
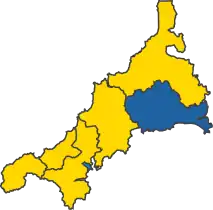 Dec 1910
1918–1945
 1918
1918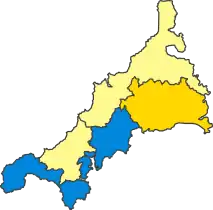 1922
1922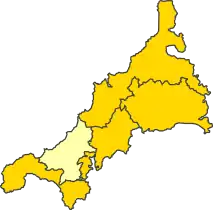 1923
1923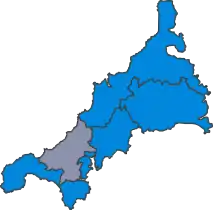 1924
1924 1929
1929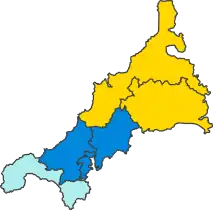 1931
1931 1935
1935 1945
1945
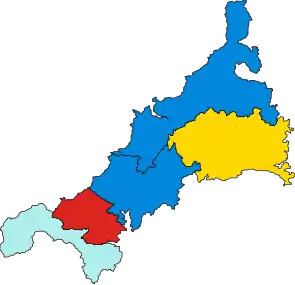
1950–present
 1950
1950- 1951
 1955
1955- 1959
 1964
1964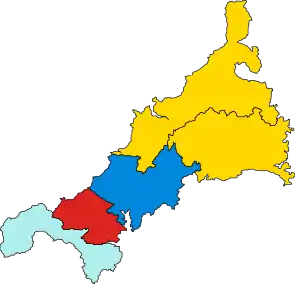 1966
1966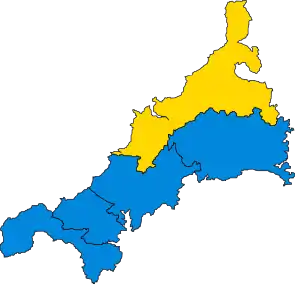 1970
1970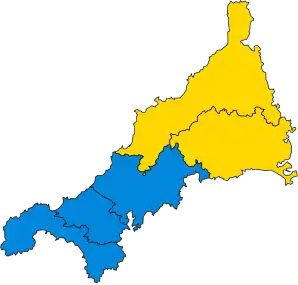 1974 Feb
 1974 Oct
 1979
1979 1983
1983- 1987
 1992
1992 1997
1997- 2001
 2005
2005 2010
2010 2015
2015- 2017
- 2019
Historical representation by party
A cell marked → (with a different colour background to the preceding cell) indicates that the previous MP continued to sit under a new party name.
1832 to 1868 (14 MPs)
Conservative Independent Liberal Liberal Peelite Radical Whig
| Constituency | 1832 | 1835 | 1837 | 38 | 40 | 1841 | 42 | 43 | 44 | 45 | 46 | 1847 | 49 | 1852 | 53 | 54 | 1857 | 58 | 1859 | 59 | 65 | 1865 | 66 | 68 |
|---|---|---|---|---|---|---|---|---|---|---|---|---|---|---|---|---|---|---|---|---|---|---|---|---|
| Bodmin | Peter | C. Vivian | Spry | Wyld | Michell | J. C. Vivian | Leveson-Gower | |||||||||||||||||
| Spry | → | Gardner | Lacy | Graves-Sawle | Wyld | Michell | Wyld | |||||||||||||||||
| Cornwall Eastern | Molesworth | R. H. Vivian | W. Rashleigh | T. J. Agar-Robartes | → | |||||||||||||||||||
| W. Salusbury-Trelawny | Eliot | Pole-Carew | Kendall | |||||||||||||||||||||
| Cornwall Western | Wynne-Pendarves | Williams | St Aubyn | → | ||||||||||||||||||||
| Lemon | Boscawen-Rose | Lemon | Davey | → | ||||||||||||||||||||
| Helston | Lane-Fox | Townshend | Sackville | Basset | R. Vyvyan | Trueman | Rogers | Young | W. Brett | |||||||||||||||
| Launceston | Hardinge | Bowles | Percy | Haliburton | Campbell | Lopes | ||||||||||||||||||
| Liskeard | C. Buller | Crowder | Grey | Osborne | A. Buller | |||||||||||||||||||
| Penryn & Falmouth | Rolfe | Hutchins | J. C. Vivian | Gwyn | Baring | → | Smith | |||||||||||||||||
| Bury | Freshfield | Plumridge | Mowatt | Freshfield | Gurney | |||||||||||||||||||
| St Ives | Halse | W. Praed | Powlett | Laffan | Paull | |||||||||||||||||||
| Truro | R. H. Vivian | J. E. Vivian | A. Smith | → | J. C. Vivian | |||||||||||||||||||
| Tooke | Turner | H. Willyams | H. Vivian | E. Willyams | M. Smith | F. Williams | ||||||||||||||||||
1868 to 1885 (13 MPs)
1885 to 1918 (7 MPs)
Conservative Independent Liberal Liberal Liberal Unionist
| Constituency | 1885 | 1886 | 87 | 1892 | 1895 | 98 | 99 | 1900 | 03 | 04 | 1906 | 06 | 08 | Jan 1910 | Dec 1910 | 12 | 15 | 16 |
|---|---|---|---|---|---|---|---|---|---|---|---|---|---|---|---|---|---|---|
| Bodmin | Courtney | → | → | Molesworth | Agar-Robartes | Freeman-Thomas | Grenfell | Pole-Carew | → | Hanson | ||||||||
| Camborne | Conybeare | → | Strauss | Caine | Lawson | Dunn | F. Dyke Acland | |||||||||||
| Launceston | C. Dyke-Acland | Owen | Moulton | Marks | ||||||||||||||
| Penryn and Falmouth | Jenkins | Cavendish-Bentinck | Horniman | Barker | Goldman | |||||||||||||
| St Austell | Borlase | McArthur | Agar-Robartes | Layland-Barratt | ||||||||||||||
| St Ives | St Aubyn | → | Bolitho | Hain | → | Cory | ||||||||||||
| Truro | Bickford-Smith | → | Williams | Durning-Lawrence | Morgan | |||||||||||||
1918 to 1950 (5 MPs)
Coalition Liberal (1918–22) / National Liberal (1922–23) Conservative Constitutionalist Independent Independent Liberal Labour Liberal National Liberal (1931–68)
| Constituency | 1918 | 22 | 1922 | 1923 | 1924 | 24 | 28 | 1929 | 31 | 1931 | 32 | 1935 | 37 | 39 | 41 | 1945 | 46 | 47 |
|---|---|---|---|---|---|---|---|---|---|---|---|---|---|---|---|---|---|---|
| Bodmin | Hanson | Foot | Harrison | Foot | Rathbone | B. Rathbone | Marshall | |||||||||||
| Camborne | Dyke Acland | Moreing | Jones | Moreing | → | Jones | Agnew | |||||||||||
| Cornwall North | Marks | → | → | Williams | Maclean | Dyke Acland | Horabin | → | → | |||||||||
| Penryn and Falmouth | Nicholl | Shipwright | Mansel | Pilcher | Walters | Petherick | King | |||||||||||
| St Ives | Cory | Hawke | Cory | Hawke | H. Runciman | W. Runciman | → | Beechman | ||||||||||
1950 to 2010 (5 MPs)
Conservative Labour Liberal Liberal Democrats National Liberal (1931–68)
| Constituency | 1950 | 1951 | 1955 | 1959 | 1964 | 1966 | 68 | 1970 | Feb 1974 | Oct 1974 | 1979 | 1983 | 87 | 1987 | 88 | 1992 | 1997 | 2001 | 2005 |
|---|---|---|---|---|---|---|---|---|---|---|---|---|---|---|---|---|---|---|---|
| Cornwall North | Roper | Scott-Hopkins | Pardoe | Neale | Tyler | Rogerson | |||||||||||||
| Bodmin / Cornwall South East (1983) | Marshall | Bessell | Hicks | Tyler | Hicks | Breed | |||||||||||||
| Falmouth and Camborne | Hayman | Dunwoody | Mudd | Coe | Atherton | Goldsworthy | |||||||||||||
| St Ives | Howard | Nott | → | Harris | George | ||||||||||||||
| Truro / Truro and St Austell (1997) | Wilson | Dixon | Penhaligon | Taylor | → | ||||||||||||||
2010 to present (6 MPs)
Conservative Liberal Democrats
| Constituency | 2010 | 2015 | 2017 | 2019 |
|---|---|---|---|---|
| Camborne and Redruth | Eustice | |||
| North Cornwall | Rogerson | Mann | ||
| St Ives | George | Thomas | ||
| South East Cornwall | Murray | |||
| St Austell and Newquay | Gilbert | Double | ||
| Truro and Falmouth | Newton | Mackrory | ||
See also
Notes
- ↑ The majority is the number of votes the winning candidate receives more than their nearest rival.
References
- ↑ Baker, Carl; Uberoi, Elise; Cracknell, Richard (28 January 2020). "General Election 2019: full results and analysis".
{{cite journal}}: Cite journal requires|journal=(help) - 1 2 3 "Constituencies A-Z – Election 2019". BBC News. Retrieved 24 April 2020.
- ↑ "LGBCE | Cornwall | LGBCE Site". www.lgbce.org.uk. Retrieved 15 October 2021.
- ↑ "Election Maps". www.ordnancesurvey.co.uk. Retrieved 15 October 2021.
- ↑ "The Parliamentary Constituencies (England) Order 2007". Office of Public Sector Information. Crown copyright. 13 June 2007. Retrieved 7 November 2009.
- ↑ Boundary Commission for England pp. 1004–1007
- ↑ "2023 Review | Boundary Commission for England". boundarycommissionforengland.independent.gov.uk. Retrieved 6 October 2021.
- ↑ "The 2023 Review of Parliamentary Constituency Boundaries in England – Volume one: Report | Boundary Commission for England". boundarycommissionforengland.independent.gov.uk. paras 1204-1215. Retrieved 10 July 2023.
- ↑ Watson, Christopher; Uberoi, Elise; Loft, Philip (17 April 2020). "General election results from 1918 to 2019".
{{cite journal}}: Cite journal requires|journal=(help)