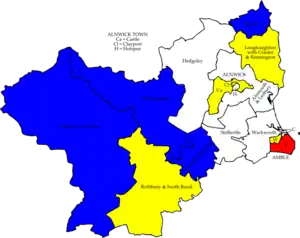
Map of the results of the 2007 Alnwick council election. Liberal Democrats in yellow, Conservatives in blue, Independents in white and Labour in red.
Elections to Alnwick District Council were held for the final time on 3 May 2007. The whole council was up for election and the council stayed under no overall control. The council was abolished in 2009 when Northumberland County Council became a unitary authority.
Election result
| Party | Seats | Gains | Losses | Net gain/loss | Seats % | Votes % | Votes | +/− | |
|---|---|---|---|---|---|---|---|---|---|
| Liberal Democrats | 11 | 2 | 2 | 0 | 36.7 | 41.1 | 7,422 | +11.1 | |
| Conservative | 9 | 7 | 0 | +7 | 30.0 | 23.9 | 4,309 | +19.8 | |
| Independent | 8 | 1 | 8 | -7 | 26.7 | 31.3 | 5,655 | -22.4 | |
| Labour | 2 | 0 | 0 | 0 | 6.7 | 3.0 | 537 | -8.6 | |
| UKIP | 0 | 0 | 0 | 0 | 0.0 | 0.7 | 132 | +0.1 | |
Ward results
| Party | Candidate | Votes | % | ±% | |
|---|---|---|---|---|---|
| Liberal Democrats | Susan Bell | 453 | |||
| Conservative | John Hope | 390 | |||
| Independent | Andrew Harrington | 360 | |||
| Liberal Democrats | James Reid | 345 | |||
| Liberal Democrats | Bryan Thompson | 331 | |||
| Independent | Teresa Thompson | 287 | |||
| Turnout | 2,166 | 33.4 | |||
| Liberal Democrats hold | Swing | ||||
| Conservative gain from Independent | Swing | ||||
| Independent hold | Swing | ||||
| Party | Candidate | Votes | % | ±% | |
|---|---|---|---|---|---|
| Liberal Democrats | Kenneth Gray | 254 | |||
| Liberal Democrats | Eileen Blakey | 194 | |||
| Independent | Kevin Thompson | 150 | |||
| Conservative | Aidan Ruff | 41 | |||
| Turnout | 639 | 23.8 | +3.1 | ||
| Liberal Democrats hold | Swing | ||||
| Liberal Democrats hold | Swing | ||||
| Party | Candidate | Votes | % | ±% | |
|---|---|---|---|---|---|
| Independent | Gordon Castle | 467 | |||
| Liberal Democrats | Clare Mills | 323 | |||
| Liberal Democrats | Andrew Smith | 226 | |||
| Independent | Geoffrey Watson | 219 | |||
| Turnout | 1,235 | 37.2 | +5.5 | ||
| Independent hold | Swing | ||||
| Liberal Democrats gain from Independent | Swing | ||||
| Party | Candidate | Votes | % | ±% | |
|---|---|---|---|---|---|
| Independent | Audrey Jones | 258 | |||
| Labour | Elizabeth Gray | 210 | |||
| Independent | Katherine Bennett | 191 | |||
| Independent | Thomas Evans | 105 | |||
| Conservative | Elizabeth Rixon | 34 | |||
| Conservative | Cynthia Sharp | 22 | |||
| Turnout | 820 | 27.4 | -2.6 | ||
| Independent hold | Swing | ||||
| Labour hold | Swing | ||||
| Party | Candidate | Votes | % | ±% | |
|---|---|---|---|---|---|
| Labour | George Arckless | 327 | |||
| Independent | John Hedley | 183 | |||
| Independent | Mark Shipperlee | 123 | |||
| Independent | George Smailes | 112 | |||
| Conservative | Alan Downie | 60 | |||
| Conservative | Charles Skipper | 57 | |||
| Turnout | 862 | 28.0 | +0.8 | ||
| Labour hold | Swing | ||||
| Independent gain from Liberal Democrats | Swing | ||||
| Party | Candidate | Votes | % | ±% | |
|---|---|---|---|---|---|
| Liberal Democrats | Ian Hinson | 346 | |||
| Conservative | Leslie Bilboe | 178 | |||
| Independent | Carl Oliver | 169 | |||
| Turnout | 693 | 31.0 | -2.0 | ||
| Liberal Democrats hold | Swing | ||||
| Conservative gain from Independent | Swing | ||||
| Party | Candidate | Votes | % | ±% | |
|---|---|---|---|---|---|
| Conservative | Robert Thorp | 254 | 53.2 | +53.2 | |
| Liberal Democrats | Lydia Cairns | 223 | 46.8 | -9.6 | |
| Majority | 31 | 6.4 | N/A | ||
| Turnout | 477 | 66.4 | +11.0 | ||
| Conservative gain from Liberal Democrats | Swing | ||||
| Party | Candidate | Votes | % | ±% | |
|---|---|---|---|---|---|
| Conservative | Susan Bolam | 256 | 61.4 | ||
| Liberal Democrats | Paul Cowie | 161 | 38.6 | ||
| Majority | 95 | 22.8 | |||
| Turnout | 417 | 54.1 | |||
| Conservative hold | Swing | ||||
| Party | Candidate | Votes | % | ±% | |
|---|---|---|---|---|---|
| Independent | John Taylor | 289 | 83.8 | ||
| Conservative | Helen Ruff | 56 | 16.2 | ||
| Majority | 233 | 67.6 | |||
| Turnout | 345 | 47.4 | |||
| Independent hold | Swing | ||||
| Party | Candidate | Votes | % | ±% | |
|---|---|---|---|---|---|
| Independent | Hugh Philipson | 540 | |||
| Liberal Democrats | Roger Styring | 480 | |||
| Conservative | Anne Glassey | 167 | |||
| UKIP | Michael Weatheritt | 132 | |||
| Turnout | 1,319 | 52.8 | +1.3 | ||
| Independent hold | Swing | ||||
| Liberal Democrats hold | Swing | ||||
| Party | Candidate | Votes | % | ±% | |
|---|---|---|---|---|---|
| Conservative | Trevor Thorne | 458 | 77.0 | ||
| Liberal Democrats | Lynne Roxburgh | 137 | 23.0 | ||
| Majority | 321 | 54.0 | |||
| Turnout | 595 | 60.0 | |||
| Conservative hold | Swing | ||||
| Party | Candidate | Votes | % | ±% | |
|---|---|---|---|---|---|
| Liberal Democrats | Carol Grey | 418 | |||
| Conservative | Thomas Spence | 336 | |||
| Conservative | Dominic Coupe | 289 | |||
| Turnout | 1,043 | 41.4 | +2.5 | ||
| Liberal Democrats hold | Swing | ||||
| Conservative gain from Independent | Swing | ||||
| Party | Candidate | Votes | % | ±% | |
|---|---|---|---|---|---|
| Liberal Democrats | Peter Dawson | 722 | |||
| Liberal Democrats | Steven Bridgett | 587 | |||
| Conservative | Elisabeth Bainbridge | 522 | |||
| Liberal Democrats | Andrew Duffield | 496 | |||
| Independent | Alan Renton | 488 | |||
| Conservative | Ian Glendinning | 476 | |||
| Turnout | 3,291 | 51.4 | |||
| Liberal Democrats hold | Swing | ||||
| Liberal Democrats hold | Swing | ||||
| Conservative gain from Independent | Swing | ||||
| Party | Candidate | Votes | % | ±% | |
|---|---|---|---|---|---|
| Independent | Maria Haddow | 683 | |||
| Liberal Democrats | Ether Mills | 529 | |||
| Conservative | David Rixon | 519 | |||
| Liberal Democrats | William Blakey | 462 | |||
| Turnout | 2,193 | 46.8 | +6.6 | ||
| Independent hold | Swing | ||||
| Liberal Democrats hold | Swing | ||||
| Conservative gain from Independent | Swing | ||||
| Party | Candidate | Votes | % | ±% | |
|---|---|---|---|---|---|
| Independent | Jeffrey Watson | 533 | |||
| Liberal Democrats | John Hobrough | 416 | |||
| Independent | Alison Sharpe | 326 | |||
| Liberal Democrats | Roger Cashmore | 319 | |||
| Turnout | 1,594 | 47.9 | +9.1 | ||
| Independent hold | Swing | ||||
| Liberal Democrats gain from Independent | Swing | ||||
| Party | Candidate | Votes | % | ±% | |
|---|---|---|---|---|---|
| Conservative | Zoe Frais | 197 | 53.4 | +53.4 | |
| Independent | John Rutherford | 172 | 46.6 | -14.4 | |
| Majority | 25 | 6.8 | N/A | ||
| Turnout | 369 | 47.7 | +8.1 | ||
| Conservative gain from Independent | Swing | ||||
External links
| Northumberland County Council | |
|---|---|
| Alnwick District Council | |
| Berwick-upon-Tweed Borough Council |
|
| Blyth Valley Borough Council |
|
| Castle Morpeth Borough Council |
|
| Tynedale District Council | |
| Wansbeck District Council |
|
| |
This article is issued from Wikipedia. The text is licensed under Creative Commons - Attribution - Sharealike. Additional terms may apply for the media files.