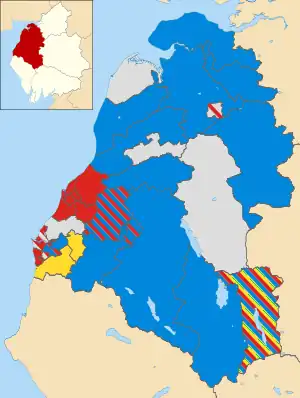
Map of the results of the 2007 Allerdale council election. Labour in red, Conservatives in blue, Independents in grey and Liberal Democrats in yellow.
Elections to Allerdale Borough Council were held on 3 May 2007. The whole council was up for election and the council stayed under no overall control.
Results
| Party | Seats | Gains | Losses | Net gain/loss | Seats % | Votes % | Votes | +/− | |
|---|---|---|---|---|---|---|---|---|---|
| Labour | 21 | 1 | 7 | -6 | 37.5 | 45.3 | 17,350 | +1.3% | |
| Conservative | 19 | 5 | 1 | +4 | 33.9 | 21.1 | 8,076 | +1.5% | |
| Independent | 12 | 4 | 1 | +3 | 21.4 | 25.5 | 9,775 | +2.4% | |
| Liberal Democrats | 4 | 1 | 2 | -1 | 7.1 | 4.1 | 1,579 | -8.3% | |
| BNP | 0 | 0 | 0 | 0 | 0 | 2.9 | 1,102 | +2.1% | |
| Green | 0 | 0 | 0 | 0 | 0 | 1.1 | 405 | +1.1% | |
9 Conservative, 4 Labour, 1 Independent and 1 Liberal Democrat candidates were unopposed.
By ward
| Party | Candidate | Votes | % | ±% | |
|---|---|---|---|---|---|
| Labour | Alan Smith | 874 | |||
| Conservative | Samuel Standage | 767 | |||
| Conservative | Stephen Coates | 745 | |||
| Labour | Christine Smith | 695 | |||
| Conservative | Alan Tyson | 666 | |||
| Labour | Jonathon Nagle | 642 | |||
| Turnout | 4,389 | 49 | +13 | ||
| Labour hold | Swing | ||||
| Conservative hold | Swing | ||||
| Conservative gain from Labour | Swing | ||||
| Party | Candidate | Votes | % | ±% | |
|---|---|---|---|---|---|
| Independent | David Wilson | 490 | |||
| Independent | Audrey Tinnion | 483 | |||
| Labour | Gerald Sewell | 424 | |||
| Labour | Henry Barker | 318 | |||
| Turnout | 1,715 | 38 | -2 | ||
| Independent hold | Swing | ||||
| Independent gain from Labour | Swing | ||||
| Party | Candidate | Votes | % | ±% | |
|---|---|---|---|---|---|
| Independent | Joseph Mumberson | uncontested | |||
| Independent hold | Swing | ||||
| Party | Candidate | Votes | % | ±% | |
|---|---|---|---|---|---|
| Conservative | Eric Nicholson | 659 | |||
| Labour | John Ardron | 638 | |||
| Conservative | Adrian Davis-Johnston | 637 | |||
| Labour | Ken McDonald | 523 | |||
| BNP | Nigel Williamson | 137 | |||
| Turnout | 2,594 | 47 | |||
| Conservative gain from Labour | Swing | ||||
| Labour hold | Swing | ||||
| Party | Candidate | Votes | % | ±% | |
|---|---|---|---|---|---|
| Conservative | Margaret Jackson | 673 | |||
| Conservative | Les Lytollis | 571 | |||
| Labour | Isabel Burns | 360 | |||
| Labour | Phil Graham | 320 | |||
| Turnout | 1,924 | 36 | +4 | ||
| Conservative hold | Swing | ||||
| Conservative hold | Swing | ||||
| Party | Candidate | Votes | % | ±% | |
|---|---|---|---|---|---|
| Liberal Democrats | Heather McIntosh | 290 | 51.6 | +18.6 | |
| Labour | Maureen Rourke | 272 | 48.4 | -18.6 | |
| Majority | 18 | 3.2 | |||
| Turnout | 562 | 49 | +3 | ||
| Liberal Democrats gain from Labour | Swing | ||||
| Party | Candidate | Votes | % | ±% | |
|---|---|---|---|---|---|
| Conservative | Joseph Milburn | 458 | 68.3 | ||
| Green | Jill Perry | 213 | 31.7 | ||
| Majority | 245 | 36.6 | |||
| Turnout | 671 | 53 | +4 | ||
| Conservative hold | Swing | ||||
| Party | Candidate | Votes | % | ±% | |
|---|---|---|---|---|---|
| Conservative | Chris Garrard | uncontested | |||
| Conservative hold | Swing | ||||
| Party | Candidate | Votes | % | ±% | |
|---|---|---|---|---|---|
| Conservative | Timothy Heslop | uncontested | |||
| Conservative hold | Swing | ||||
| Party | Candidate | Votes | % | ±% | |
|---|---|---|---|---|---|
| Labour | Louise Bell | 401 | |||
| Labour | John Colhoun | 338 | |||
| Conservative | Tony North | 229 | |||
| Independent | David Thomas | 197 | |||
| Green | Geoff Smith | 192 | |||
| Turnout | 1,357 | 36 | |||
| Labour hold | Swing | ||||
| Labour hold | Swing | ||||
| Party | Candidate | Votes | % | ±% | |
|---|---|---|---|---|---|
| Labour | Janice Wood | 635 | |||
| Labour | Martin Wood | 580 | |||
| BNP | Martin Wingfield | 342 | |||
| Turnout | 1,557 | 35 | |||
| Labour hold | Swing | ||||
| Labour hold | Swing | ||||
| Party | Candidate | Votes | % | ±% | |
|---|---|---|---|---|---|
| Labour | Carl Holding | 610 | |||
| Labour | Carni McCarron-Holmes | 572 | |||
| BNP | Tina Wingfield | 276 | |||
| Turnout | 1,458 | 37 | |||
| Labour hold | Swing | ||||
| Labour hold | Swing | ||||
| Party | Candidate | Votes | % | ±% | |
|---|---|---|---|---|---|
| Labour | Peter Kendall | uncontested | |||
| Labour hold | Swing | ||||
| Party | Candidate | Votes | % | ±% | |
|---|---|---|---|---|---|
| Liberal Democrats | Ian Francis | 610 | |||
| Liberal Democrats | Allan Caine | 594 | |||
| Labour | Merjorie Rae | 534 | |||
| Independent | Hilary Harrington | 363 | |||
| Turnout | 2,101 | 40 | +6 | ||
| Liberal Democrats hold | Swing | ||||
| Liberal Democrats hold | Swing | ||||
| Party | Candidate | Votes | % | ±% | |
|---|---|---|---|---|---|
| Conservative | Tony Markley | 324 | 73.1 | +35.8 | |
| Labour | Mark Hayhurst | 119 | 26.7 | +1.6 | |
| Majority | 205 | 46.4 | +34.2 | ||
| Turnout | 443 | 34 | +4 | ||
| Conservative hold | Swing | ||||
| Party | Candidate | Votes | % | ±% | |
|---|---|---|---|---|---|
| Labour | Denstone Kemp | uncontested | |||
| Conservative | Ron Munby | uncontested | |||
| Liberal Democrats | David Robinson | uncontested | |||
| Labour hold | Swing | ||||
| Conservative hold | Swing | ||||
| Liberal Democrats hold | Swing | ||||
| Party | Candidate | Votes | % | ±% | |
|---|---|---|---|---|---|
| Conservative | Vaughan Hodgson | uncontested | |||
| Conservative gain from Liberal Democrats | Swing | ||||
| Party | Candidate | Votes | % | ±% | |
|---|---|---|---|---|---|
| Labour | Peter Bales | 602 | |||
| Labour | Nik Hardy | 546 | |||
| Independent | Joseph Robertson | 522 | |||
| Labour | Phil Tibble | 403 | |||
| Turnout | 2,073 | 55 | +31 | ||
| Labour hold | Swing | ||||
| Labour hold | Swing | ||||
| Independent gain from Labour | Swing | ||||
| Party | Candidate | Votes | % | ±% | |
|---|---|---|---|---|---|
| Labour | Barbara Cannon | 507 | |||
| Labour | Carole Armstrong | 439 | |||
| Labour | Bill Bacon | 432 | |||
| Independent | John Bracken | 430 | |||
| Turnout | 1,808 | 27 | +2 | ||
| Labour hold | Swing | ||||
| Labour hold | Swing | ||||
| Labour hold | Swing | ||||
| Party | Candidate | Votes | % | ±% | |
|---|---|---|---|---|---|
| Labour | Jeffrey Gardner | uncontested | |||
| Labour | Angela Kendall | uncontested | |||
| Labour hold | Swing | ||||
| Labour hold | Swing | ||||
| Party | Candidate | Votes | % | ±% | |
|---|---|---|---|---|---|
| Independent | Trevor Fee | 1,074 | |||
| Independent | Joseph Sandwith | 941 | |||
| Independent | Miriam Gainford | 777 | |||
| Labour | Jim Musgrave | 478 | |||
| Labour | Celia Tibble | 468 | |||
| Turnout | 3,738 | 40 | +3 | ||
| Independent hold | Swing | ||||
| Independent hold | Swing | ||||
| Independent gain from Labour | Swing | ||||
| Party | Candidate | Votes | % | ±% | |
|---|---|---|---|---|---|
| Independent | Bill Jefferson | 683 | |||
| Independent | Margaret Snaith | 597 | |||
| Labour | Jonathon Wood | 185 | |||
| Turnout | 1,465 | 37 | |||
| Independent hold | Swing | ||||
| Independent gain from Labour | Swing | ||||
| Party | Candidate | Votes | % | ±% | |
|---|---|---|---|---|---|
| Conservative | James Lister | uncontested | |||
| Conservative hold | Swing | ||||
| Party | Candidate | Votes | % | ±% | |
|---|---|---|---|---|---|
| Labour | Joe Holliday | 788 | |||
| Conservative | Mike Davidson | 780 | |||
| Conservative | John Heathcote | 698 | |||
| Conservative | Richard Jones | 591 | |||
| Labour | Joan Wright | 560 | |||
| Labour | Konrad Hansen | 418 | |||
| Turnout | 3,835 | 37 | +9 | ||
| Labour gain from Conservative | Swing | ||||
| Conservative hold | Swing | ||||
| Conservative hold | Swing | ||||
| Party | Candidate | Votes | % | ±% | |
|---|---|---|---|---|---|
| Labour | Ivor Humes | 648 | |||
| Labour | Alan Barry | 639 | |||
| Independent | Jean Macleod | 637 | |||
| Labour | Mary Bainbridge | 612 | |||
| Independent | Eddie Woodthorpe | 486 | |||
| Turnout | 3,022 | 24 | -9 | ||
| Labour hold | Swing | ||||
| Labour hold | Swing | ||||
| Independent hold | Swing | ||||
| Party | Candidate | Votes | % | ±% | |
|---|---|---|---|---|---|
| Conservative | Robert Hardon | 278 | 57.6 | ||
| Labour | Ted Routledge | 120 | 24.8 | ||
| Liberal Democrats | Marl Lancaster | 85 | 17.6 | ||
| Majority | 158 | 32.8 | |||
| Turnout | 483 | 35 | |||
| Conservative hold | Swing | ||||
| Party | Candidate | Votes | % | ±% | |
|---|---|---|---|---|---|
| Conservative | Stuart Moffat | uncontested | |||
| Conservative gain from Liberal Democrats | Swing | ||||
| Party | Candidate | Votes | % | ±% | |
|---|---|---|---|---|---|
| Conservative | Duncan Fairbairn | uncontested | |||
| Conservative hold | Swing | ||||
| Party | Candidate | Votes | % | ±% | |
|---|---|---|---|---|---|
| Conservative | John Hunter | uncontested | |||
| Conservative gain from Independent | Swing | ||||
| Party | Candidate | Votes | % | ±% | |
|---|---|---|---|---|---|
| Conservative | Jacqueline Mounsey | uncontested | |||
| Conservative hold | Swing | ||||
| Party | Candidate | Votes | % | ±% | |
|---|---|---|---|---|---|
| Independent | George Scott | 821 | |||
| Independent | Binky Armstrong | 756 | |||
| Labour | John Crouch | 650 | |||
| Independent | Alan Hortin | 518 | |||
| BNP | Paul Stafford | 347 | |||
| Turnout | 3,092 | 34 | -1 | ||
| Independent hold | Swing | ||||
| Independent hold | Swing | ||||
| Labour hold | Swing | ||||
External links
- BBC report of 2007 Allerdale election results BBC News
- Election results from Allerdale Council website
This article is issued from Wikipedia. The text is licensed under Creative Commons - Attribution - Sharealike. Additional terms may apply for the media files.