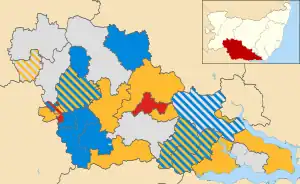
Map of the results of the 2003 Babergh council election. Liberal Democrats in yellow, Conservatives in blue, Independents in grey and Labour in red.
Elections to Babergh Council were held on 1 May 2003. The whole council was up for election with boundary changes since the last election in 1999. The council stayed under no overall control.
Election result
| Party | Seats | Gains | Losses | Net gain/loss | Seats % | Votes % | Votes | +/− | |
|---|---|---|---|---|---|---|---|---|---|
| Liberal Democrats | 18 | +5 | 41.9 | 39.8 | 11,025 | +10.3% | |||
| Conservative | 11 | +1 | 25.6 | 34.1 | 9,440 | +5.2% | |||
| Independent | 8 | -6 | 18.6 | 13.4 | 3,713 | -8.7% | |||
| Labour | 6 | +1 | 14.0 | 10.4 | 2,885 | -9.1% | |||
| Green | 0 | 0 | 0 | 1.1 | 315 | +1.1% | |||
| UKIP | 0 | 0 | 0 | 1.1 | 309 | +1.1% | |||
3 Independent, 3 Conservative and 2 Liberal Democrat councillors were unopposed.
Ward results
| Party | Candidate | Votes | % | ±% | |
|---|---|---|---|---|---|
| Liberal Democrats | David Wood | 686 | |||
| Liberal Democrats | Duncan Read | 587 | |||
| Independent | Kenneth Felstead | 380 | |||
| Conservative | Patricia Cave | 305 | |||
| Turnout | 1,958 | 37.3 | |||
| Party | Candidate | Votes | % | ±% | |
|---|---|---|---|---|---|
| Liberal Democrats | Wendy Sadler | 856 | |||
| Liberal Democrats | Shirley Clarke | 723 | |||
| Conservative | Peter Burgoyne | 267 | |||
| Turnout | 1,846 | 35.7 | |||
| Party | Candidate | Votes | % | ±% | |
|---|---|---|---|---|---|
| Liberal Democrats | Bryn Hurren | uncontested | |||
| Party | Candidate | Votes | % | ±% | |
|---|---|---|---|---|---|
| Conservative | Desmond Keane | uncontested | |||
| Party | Candidate | Votes | % | ±% | |
|---|---|---|---|---|---|
| Independent | Peter Jones | 611 | |||
| Conservative | Nicholas Ridley | 492 | |||
| Liberal Democrats | Dale Cartwright | 471 | |||
| Turnout | 1,574 | 34.8 | |||
| Party | Candidate | Votes | % | ±% | |
|---|---|---|---|---|---|
| Conservative | Peter Holbrook | uncontested | |||
| Party | Candidate | Votes | % | ±% | |
|---|---|---|---|---|---|
| Independent | James Long | uncontested | |||
| Party | Candidate | Votes | % | ±% | |
|---|---|---|---|---|---|
| Liberal Democrats | Michael Miller | 753 | |||
| Conservative | Alan Hinton | 634 | |||
| Green | Ian St. John | 315 | |||
| Turnout | 1,702 | 44.5 | |||
| Party | Candidate | Votes | % | ±% | |
|---|---|---|---|---|---|
| Liberal Democrats | Rex Thake | uncontested | |||
| Independent | Leonard Young | uncontested | |||
| Party | Candidate | Votes | % | ±% | |
|---|---|---|---|---|---|
| Labour | Anthony Bavngton | 280 | |||
| Labour | Neil MacMaster | 262 | |||
| Conservative | Carol Beer | 253 | |||
| Conservative | David Thomas | 218 | |||
| UKIP | Derek Allen | 195 | |||
| Turnout | 1,208 | 22.1 | |||
| Party | Candidate | Votes | % | ±% | |
|---|---|---|---|---|---|
| Conservative | Peter Beer | 371 | |||
| Conservative | Humphrey Todd | 353 | |||
| Labour | Susan Gibson | 234 | |||
| Labour | Patrick Treacy | 215 | |||
| Liberal Democrats | Richard Platt | 117 | |||
| UKIP | Cynthia Allen | 114 | |||
| Turnout | 1,404 | 24.6 | |||
| Party | Candidate | Votes | % | ±% | |
|---|---|---|---|---|---|
| Labour | James Quinian | 360 | |||
| Labour | Keith Grimsey | 317 | |||
| Independent | Eileen Banks | 269 | |||
| Liberal Democrats | Peter Matthews | 260 | |||
| Liberal Democrats | Ann Stephenson | 251 | |||
| Conservative | Patricia White | 154 | |||
| Turnout | 1,611 | 29.9 | |||
| Party | Candidate | Votes | % | ±% | |
|---|---|---|---|---|---|
| Liberal Democrats | David Grutchfield | 644 | |||
| Liberal Democrats | Jean Chapman | 369 | |||
| Independent | Janetta Byrne | 266 | |||
| Conservative | Sheila Webb | 232 | |||
| Labour | Penelope Cook | 186 | |||
| Labour | Susan Monks | 151 | |||
| Turnout | 1,848 | 34.4 | |||
| Party | Candidate | Votes | % | ±% | |
|---|---|---|---|---|---|
| Independent | David Rose | 380 | 57.2 | ||
| Liberal Democrats | Patricia Steggles | 284 | 42.8 | ||
| Majority | 96 | 14.4 | |||
| Turnout | 664 | 43.9 | |||
| Party | Candidate | Votes | % | ±% | |
|---|---|---|---|---|---|
| Conservative | John Roberts | 506 | 73.0 | ||
| Liberal Democrats | Fiona Jenkins | 187 | 27.0 | ||
| Majority | 319 | 46.0 | |||
| Turnout | 693 | 45.3 | |||
| Party | Candidate | Votes | % | ±% | |
|---|---|---|---|---|---|
| Conservative | Jennifer Jenkins | uncontested | |||
| Party | Candidate | Votes | % | ±% | |
|---|---|---|---|---|---|
| Independent | Richard Kemp | 800 | |||
| Independent | John Brand | 571 | |||
| Conservative | David Burch | 430 | |||
| Turnout | 1,801 | 34.3 | |||
| Party | Candidate | Votes | % | ±% | |
|---|---|---|---|---|---|
| Independent | Susan Wigglesworth | uncontested | |||
| Party | Candidate | Votes | % | ±% | |
|---|---|---|---|---|---|
| Liberal Democrats | Susan Carpendale | 781 | |||
| Conservative | Gerald White | 778 | |||
| Conservative | William Yorke-Edwards | 648 | |||
| Liberal Democrats | Leonard Johnson | 633 | |||
| Turnout | 2,840 | 45.3 | |||
| Party | Candidate | Votes | % | ±% | |
|---|---|---|---|---|---|
| Liberal Democrats | Christopher Hunt | 428 | 50.5 | ||
| Conservative | John Cave | 420 | 49.5 | ||
| Majority | 8 | 1.0 | |||
| Turnout | 848 | 53.9 | |||
| Party | Candidate | Votes | % | ±% | |
|---|---|---|---|---|---|
| Independent | Clive Arthey | 436 | 54.3 | ||
| Conservative | Richard Sands | 367 | 45.7 | ||
| Majority | 69 | 8.6 | |||
| Turnout | 803 | 45.4 | |||
| Party | Candidate | Votes | % | ±% | |
|---|---|---|---|---|---|
| Liberal Democrats | David Bushby | 358 | |||
| Liberal Democrats | Colin Kerr | 309 | |||
| Conservative | Colin Hurcombe | 255 | |||
| Turnout | 922 | 18.7 | |||
| Party | Candidate | Votes | % | ±% | |
|---|---|---|---|---|---|
| Liberal Democrats | Brian Lazenby | 438 | 62.1 | ||
| Conservative | Joyce Jardine | 267 | 37.9 | ||
| Majority | 171 | 24.2 | |||
| Turnout | 705 | 42.1 | |||
| Party | Candidate | Votes | % | ±% | |
|---|---|---|---|---|---|
| Labour | Jack Owen | 396 | |||
| Liberal Democrats | Albert Pearce | 343 | |||
| Conservative | Sylvia Byham | 331 | |||
| Turnout | 1,070 | 26.6 | |||
| Party | Candidate | Votes | % | ±% | |
|---|---|---|---|---|---|
| Conservative | John Sayers | 412 | |||
| Labour | Nicholas Irwin | 322 | |||
| Conservative | Raymond Smith | 303 | |||
| Liberal Democrats | Andrew Welsh | 214 | |||
| Turnout | 1,251 | 24.2 | |||
| Party | Candidate | Votes | % | ±% | |
|---|---|---|---|---|---|
| Liberal Democrats | Nigel Bennett | 381 | |||
| Liberal Democrats | Martyn Booth | 365 | |||
| Conservative | Peter Goodchild | 280 | |||
| Labour | David Regester | 162 | |||
| Turnout | 1,188 | 23.1 | |||
| Party | Candidate | Votes | % | ±% | |
|---|---|---|---|---|---|
| Conservative | Colin Spence | 664 | |||
| Liberal Democrats | Elizabeth Bates | 587 | |||
| Conservative | David Jardine | 500 | |||
| Turnout | 1,751 | 34.2 | |||
External links
| Suffolk County Council | |
|---|---|
| Babergh District Council | |
| East Suffolk District Council | |
| Ipswich Borough Council | |
| Mid Suffolk District Council | |
| West Suffolk District Council | |
| East Suffolk County Council |
|
| Forest Heath District Council | |
| St Edmundsbury Borough Council | |
| Suffolk Coastal District Council | |
| Waveney District Council | |
| West Suffolk County Council |
|
| |
This article is issued from Wikipedia. The text is licensed under Creative Commons - Attribution - Sharealike. Additional terms may apply for the media files.