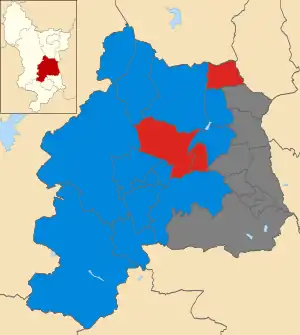
Map of the results of the 2003 Amber Valley council election. Conservatives in blue and Labour in red. Wards in grey were not contested in 2003.
Elections to Amber Valley Borough Council were held on 1 May 2003. One third of the council was up for election and the Conservative Party held overall control of the council.
After the election, the composition of the council was:
- Conservative 25
- Labour 20
Election result
| Party | Seats | Gains | Losses | Net gain/loss | Seats % | Votes % | Votes | +/− | |
|---|---|---|---|---|---|---|---|---|---|
| Conservative | 12 | -1 | 80.0 | 53.2 | 9,734 | +16.1% | |||
| Labour | 3 | +1 | 20.0 | 37.0 | 6,770 | -15.5% | |||
| Liberal Democrats | 0 | 0 | 0 | 7.6 | 1,386 | +2.0% | |||
| Independent | 0 | 0 | 0 | 2.2 | 411 | -2.2% | |||
Ward results
| Party | Candidate | Votes | % | ±% | |
|---|---|---|---|---|---|
| Labour | Gillian Dolman | 716 | 54.1 | ||
| Conservative | David Wilson | 450 | 34.0 | ||
| Liberal Democrats | Paul Gibbons | 158 | 11.9 | ||
| Majority | 266 | 20.1 | |||
| Turnout | 1,324 | ||||
| Party | Candidate | Votes | % | ±% | |
|---|---|---|---|---|---|
| Conservative | Deborah Biss | 629 | 70.4 | ||
| Labour | Tony Munro | 142 | 15.9 | ||
| Liberal Democrats | Peter Handscombe | 123 | 13.8 | ||
| Majority | 487 | 54.5 | |||
| Turnout | 894 | ||||
| Party | Candidate | Votes | % | ±% | |
|---|---|---|---|---|---|
| Conservative | Peter Makin | 711 | 59.0 | ||
| Labour | Brenda Remington | 494 | 41.0 | ||
| Majority | 217 | 18.0 | |||
| Turnout | 1,205 | ||||
| Party | Candidate | Votes | % | ±% | |
|---|---|---|---|---|---|
| Conservative | Leslie Dorey | 553 | 49.1 | +2.5 | |
| Labour | Alan Broughton | 411 | 36.5 | -7.1 | |
| Liberal Democrats | Timothy Clark | 162 | 14.4 | +14.4 | |
| Majority | 142 | 12.6 | +9.6 | ||
| Turnout | 1,126 | ||||
| Party | Candidate | Votes | % | ±% | |
|---|---|---|---|---|---|
| Conservative | Simon Hitchcock | 660 | 52.2 | ||
| Labour | Peter Shepherd | 364 | 28.8 | ||
| Liberal Democrats | Roger Shelley | 147 | 11.6 | ||
| Independent | Margaret Jackson | 94 | 7.4 | ||
| Majority | 296 | 23.4 | |||
| Turnout | 1,265 | ||||
| Party | Candidate | Votes | % | ±% | |
|---|---|---|---|---|---|
| Conservative | Peter Arnold | 614 | 56.3 | +6.3 | |
| Labour | Ronald Buzzard | 476 | 43.7 | -6.3 | |
| Majority | 138 | 12.6 | +12.5 | ||
| Turnout | 1,090 | ||||
| Party | Candidate | Votes | % | ±% | |
|---|---|---|---|---|---|
| Conservative | Glyn Hartshorne | 450 | 62.8 | ||
| Labour | Kenneth Armstrong | 134 | 18.7 | ||
| Liberal Democrats | Catherine Smith | 132 | 18.4 | ||
| Majority | 316 | 44.1 | |||
| Turnout | 716 | ||||
| Party | Candidate | Votes | % | ±% | |
|---|---|---|---|---|---|
| Conservative | Anthony Woodings | 851 | 57.3 | -2.8 | |
| Labour | Patrick Mountain | 318 | 21.4 | -18.5 | |
| Liberal Democrats | Deena Smith | 316 | 21.3 | +21.3 | |
| Majority | 433 | 35.9 | +15.7 | ||
| Turnout | 1,485 | ||||
| Party | Candidate | Votes | % | ±% | |
|---|---|---|---|---|---|
| Labour | Maurice Gent | 739 | 51.3 | ||
| Conservative | Juliette Blake | 559 | 38.8 | ||
| Liberal Democrats | Anthony Cooper | 142 | 9.9 | ||
| Majority | 180 | 12.5 | |||
| Turnout | 1,440 | ||||
| Party | Candidate | Votes | % | ±% | |
|---|---|---|---|---|---|
| Conservative | Albert Hall | 845 | 47.2 | +5.6 | |
| Labour | Susan Reaney | 741 | 41.4 | -2.9 | |
| Liberal Democrats | Jeremy Benson | 206 | 11.5 | -2.6 | |
| Majority | 104 | 5.8 | +3.1 | ||
| Turnout | 1,792 | ||||
| Party | Candidate | Votes | % | ±% | |
|---|---|---|---|---|---|
| Conservative | Kathleen Brown | 890 | 50.2 | ||
| Labour | Walter Fryer | 882 | 49.8 | ||
| Majority | 8 | 0.4 | |||
| Turnout | 1,772 | ||||
| Party | Candidate | Votes | % | ±% | |
|---|---|---|---|---|---|
| Labour | Geoffrey Carlile | 627 | 53.1 | ||
| Conservative | Patricia Bowmar | 404 | 34.2 | ||
| Independent | Alex Stevenson | 150 | 12.7 | ||
| Majority | 223 | 18.9 | |||
| Turnout | 1,181 | ||||
| Party | Candidate | Votes | % | ±% | |
|---|---|---|---|---|---|
| Conservative | John Cunningham | 750 | 85.4 | ||
| Labour | Diana Hancock | 128 | 14.6 | ||
| Majority | 622 | 70.8 | |||
| Turnout | 878 | ||||
| Party | Candidate | Votes | % | ±% | |
|---|---|---|---|---|---|
| Conservative | Stephen Hayes | 733 | 55.9 | -6.2 | |
| Labour | Paul Smith | 411 | 31.4 | -6.5 | |
| Independent | John Pidcock | 167 | 12.7 | +12.7 | |
| Majority | 322 | 24.5 | |||
| Turnout | 1,311 | ||||
| Party | Candidate | Votes | % | ±% | |
|---|---|---|---|---|---|
| Conservative | Valerie Thorpe | 635 | 77.3 | ||
| Labour | Graham Naylor | 187 | 22.7 | ||
| Majority | 448 | 54.6 | |||
| Turnout | 822 | ||||
External links
This article is issued from Wikipedia. The text is licensed under Creative Commons - Attribution - Sharealike. Additional terms may apply for the media files.