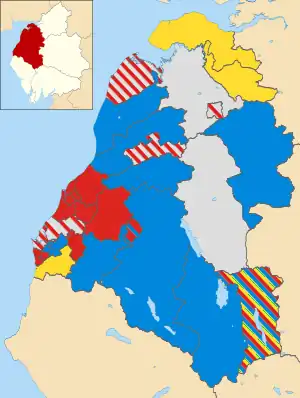
Map of the results of the 2003 Allerdale council election. Labour in red, Conservatives in blue, Independents in grey and Liberal Democrats in yellow.
Elections to Allerdale Borough Council were held on 1 May 2003. The whole council was up for election and the Labour party lost overall control of the council to no overall control.
Results
| Party | Seats | Gains | Losses | Net gain/loss | Seats % | Votes % | Votes | +/− | |
|---|---|---|---|---|---|---|---|---|---|
| Labour | 27 | 0 | 9 | -9 | 48.2 | 44.0 | 14,159 | -8.1% | |
| Conservative | 15 | 7 | 0 | +7 | 26.8 | 19.6 | 6,313 | -0.5% | |
| Independent | 9 | 5 | 1 | +4 | 16.1 | 23.1 | 7,411 | +11.4% | |
| Liberal Democrats | 5 | 0 | 2 | -2 | 8.9 | 12.4 | 4,000 | -3.1% | |
| BNP | 0 | 0 | 0 | 0 | 0 | 0.8 | 261 | +0.8% | |
12 Labour, 4 Conservative, 2 Independent and 2 Liberal Democrat candidates were unopposed.
By ward
| Party | Candidate | Votes | % | ±% | |
|---|---|---|---|---|---|
| Labour | Alan Smith | 717 | |||
| Conservative | Samuel Standage | 630 | |||
| Labour | Dianne Moyes | 624 | |||
| Labour | Christine Smith | 601 | |||
| Conservative | William Newton | 599 | |||
| Conservative | Alan Tyson | 524 | |||
| Turnout | 3,695 | 36 | |||
| Labour hold | Swing | ||||
| Conservative hold | Swing | ||||
| Labour hold | Swing | ||||
| Party | Candidate | Votes | % | ±% | |
|---|---|---|---|---|---|
| Labour | Gerald Sewell | 488 | |||
| Independent | David Wilson | 469 | |||
| Independent | Dorothy Tinnion | 430 | |||
| Labour | Jacqueline Stagg | 365 | |||
| Turnout | 1,752 | 40 | |||
| Labour hold | Swing | ||||
| Independent hold | Swing | ||||
| Party | Candidate | Votes | % | ±% | |
|---|---|---|---|---|---|
| Independent | Joseph Mumberson | uncontested | |||
| Independent hold | Swing | ||||
| Party | Candidate | Votes | % | ±% | |
|---|---|---|---|---|---|
| Labour | James Askew | uncontested | |||
| Labour | Keith Sproat | uncontested | |||
| Labour hold | Swing | ||||
| Labour hold | Swing | ||||
| Party | Candidate | Votes | % | ±% | |
|---|---|---|---|---|---|
| Conservative | Christine Jackson | 543 | |||
| Conservative | Leslie Lytollis | 497 | |||
| Labour | Isabel Burns | 330 | |||
| Labour | John Moore | 253 | |||
| Turnout | 1,623 | 32 | |||
| Conservative hold | Swing | ||||
| Conservative hold | Swing | ||||
| Party | Candidate | Votes | % | ±% | |
|---|---|---|---|---|---|
| Labour | Maureen Rourke | 371 | 67.0 | +16.0 | |
| Liberal Democrats | Dean Hudson | 183 | 33.0 | -16.0 | |
| Majority | 188 | 34.0 | +32.0 | ||
| Turnout | 554 | 46 | +5 | ||
| Labour hold | Swing | ||||
| Party | Candidate | Votes | % | ±% | |
|---|---|---|---|---|---|
| Conservative | Joseph Milburn | uncontested | |||
| Conservative hold | Swing | ||||
| Party | Candidate | Votes | % | ±% | |
|---|---|---|---|---|---|
| Conservative | Simon Greenwood | uncontested | |||
| Conservative hold | Swing | ||||
| Party | Candidate | Votes | % | ±% | |
|---|---|---|---|---|---|
| Conservative | Timothy Heslop | 256 | 54.8 | -24.3 | |
| Liberal Democrats | David Robinson | 211 | 45.2 | +45.2 | |
| Majority | 45 | 9.6 | -48.6 | ||
| Turnout | 467 | 35 | +0 | ||
| Conservative hold | Swing | ||||
| Party | Candidate | Votes | % | ±% | |
|---|---|---|---|---|---|
| Labour | John Colhoun | uncontested | |||
| Labour | David Thomas | uncontested | |||
| Labour hold | Swing | ||||
| Labour hold | Swing | ||||
| Party | Candidate | Votes | % | ±% | |
|---|---|---|---|---|---|
| Labour | Martin Wood | uncontested | |||
| Labour | Janice Wood | uncontested | |||
| Labour hold | Swing | ||||
| Labour hold | Swing | ||||
| Party | Candidate | Votes | % | ±% | |
|---|---|---|---|---|---|
| Labour | Carneen McCarron-Holmes | uncontested | |||
| Labour | Patricia McCracken | uncontested | |||
| Labour hold | Swing | ||||
| Labour hold | Swing | ||||
| Party | Candidate | Votes | % | ±% | |
|---|---|---|---|---|---|
| Labour | Peter Kendall | uncontested | |||
| Labour hold | Swing | ||||
| Party | Candidate | Votes | % | ±% | |
|---|---|---|---|---|---|
| Liberal Democrats | Allan Caine | 601 | |||
| Liberal Democrats | Ian Francis | 515 | |||
| Labour | James Osborn | 280 | |||
| Labour | Michael Smith | 222 | |||
| Turnout | 1,618 | 34 | |||
| Liberal Democrats hold | Swing | ||||
| Liberal Democrats hold | Swing | ||||
| Party | Candidate | Votes | % | ±% | |
|---|---|---|---|---|---|
| Conservative | Anthony Markley | 141 | 37.3 | ||
| Independent | William Douglas | 95 | 25.1 | ||
| Labour | Mark Kidd | 95 | 25.1 | ||
| Liberal Democrats | Margrit Scott | 47 | 12.4 | ||
| Majority | 46 | 12.2 | |||
| Turnout | 378 | 30 | |||
| Conservative gain from Labour | Swing | ||||
| Party | Candidate | Votes | % | ±% | |
|---|---|---|---|---|---|
| Liberal Democrats | Elizabeth Barraclough | 1,076 | |||
| Conservative | Ronald Munby | 696 | |||
| Labour | Denstone Kemp | 581 | |||
| Independent | John Walker | 567 | |||
| Turnout | 2,920 | 36 | |||
| Liberal Democrats hold | Swing | ||||
| Conservative gain from Independent | Swing | ||||
| Labour hold | Swing | ||||
| Party | Candidate | Votes | % | ±% | |
|---|---|---|---|---|---|
| Liberal Democrats | Jennifer Gallagher | uncontested | |||
| Liberal Democrats hold | Swing | ||||
| Party | Candidate | Votes | % | ±% | |
|---|---|---|---|---|---|
| Labour | Joan Minto | 567 | |||
| Labour | Peter Bales | 542 | |||
| Labour | Philip Tibble | 418 | |||
| Liberal Democrats | Linda Walker | 285 | |||
| Liberal Democrats | Christine Johanssen | 279 | |||
| Liberal Democrats | John Morley | 266 | |||
| Turnout | 2,357 | 24 | |||
| Labour hold | Swing | ||||
| Labour hold | Swing | ||||
| Labour hold | Swing | ||||
| Party | Candidate | Votes | % | ±% | |
|---|---|---|---|---|---|
| Labour | Lillian Baldry | 613 | |||
| Labour | Derek Thompson | 531 | |||
| Labour | Nicholas Hardy | 485 | |||
| Independent | John Bracken | 228 | |||
| Liberal Democrats | Shaun Heywood | 173 | |||
| Turnout | 2,030 | 25 | |||
| Labour hold | Swing | ||||
| Labour hold | Swing | ||||
| Labour hold | Swing | ||||
| Party | Candidate | Votes | % | ±% | |
|---|---|---|---|---|---|
| Labour | Jeffrey Gardner | uncontested | |||
| Labour | Angela Kendall | uncontested | |||
| Labour hold | Swing | ||||
| Labour hold | Swing | ||||
| Party | Candidate | Votes | % | ±% | |
|---|---|---|---|---|---|
| Independent | Joseph Sandwith | 1,050 | |||
| Independent | Trevor Fee | 785 | |||
| Labour | James Musgrave | 644 | |||
| Labour | Denis Tytek | 492 | |||
| Labour | Mark Fryer | 431 | |||
| Turnout | 3,402 | 37 | |||
| Independent gain from Labour | Swing | ||||
| Independent gain from Labour | Swing | ||||
| Labour hold | Swing | ||||
| Party | Candidate | Votes | % | ±% | |
|---|---|---|---|---|---|
| Independent | William Jefferson | uncontested | |||
| Labour | Margaret Snaith | uncontested | |||
| Independent hold | Swing | ||||
| Labour hold | Swing | ||||
| Party | Candidate | Votes | % | ±% | |
|---|---|---|---|---|---|
| Conservative | James Buchanan | 274 | 57.3 | ||
| Independent | Dorothy Tinnion | 87 | 18.2 | ||
| Independent | Janice Nott | 69 | 14.4 | ||
| Labour | Mark Kidd | 48 | 10.0 | ||
| Majority | 187 | 39.1 | |||
| Turnout | 478 | 36 | |||
| Conservative gain from Labour | Swing | ||||
| Party | Candidate | Votes | % | ±% | |
|---|---|---|---|---|---|
| Conservative | John Heathcote | 635 | |||
| Conservative | Robert Hardon | 589 | |||
| Conservative | Michael Davidson | 572 | |||
| Labour | John Robertson | 472 | |||
| Labour | Daniel Dempsey | 443 | |||
| Labour | Kenneth Hayton | 388 | |||
| Turnout | 3,099 | 28 | |||
| Conservative gain from Labour | Swing | ||||
| Conservative gain from Labour | Swing | ||||
| Conservative gain from Labour | Swing | ||||
| Party | Candidate | Votes | % | ±% | |
|---|---|---|---|---|---|
| Labour | Ivor Humes | 705 | |||
| Labour | Alan Barry | 673 | |||
| Independent | Jean Macleod | 599 | |||
| Labour | Jack Fryer | 570 | |||
| Independent | James Perkins | 432 | |||
| Turnout | 2,979 | 33 | |||
| Labour hold | Swing | ||||
| Labour hold | Swing | ||||
| Independent gain from Labour | Swing | ||||
| Party | Candidate | Votes | % | ±% | |
|---|---|---|---|---|---|
| Conservative | Richard Jones | uncontested | |||
| Conservative hold | Swing | ||||
| Party | Candidate | Votes | % | ±% | |
|---|---|---|---|---|---|
| Liberal Democrats | Anne Holmes | uncontested | |||
| Liberal Democrats hold | Swing | ||||
| Party | Candidate | Votes | % | ±% | |
|---|---|---|---|---|---|
| Conservative | Duncan Fairbairn | 357 | 63.5 | +63.5 | |
| Liberal Democrats | Agnes Martin | 205 | 36.5 | -34.3 | |
| Majority | 152 | 27.0 | |||
| Turnout | 562 | 36 | +3 | ||
| Conservative gain from Liberal Democrats | Swing | ||||
| Party | Candidate | Votes | % | ±% | |
|---|---|---|---|---|---|
| Independent | Joseph Cowell | 238 | 59.9 | -17.4 | |
| Liberal Democrats | Patrick Short | 159 | 40.1 | +40.1 | |
| Majority | 79 | 19.8 | -44.8 | ||
| Turnout | 397 | 28 | -2 | ||
| Independent hold | Swing | ||||
| Party | Candidate | Votes | % | ±% | |
|---|---|---|---|---|---|
| Conservative | Robert Hobbs | uncontested | |||
| Conservative hold | Swing | ||||
| Party | Candidate | Votes | % | ±% | |
|---|---|---|---|---|---|
| Independent | John Armstrong | 917 | |||
| Independent | George Scott | 898 | |||
| Labour | John Crouch | 690 | |||
| Independent | Charles Miles | 547 | |||
| Labour | William Goldsmith | 274 | |||
| BNP | Paul Stafford | 261 | |||
| Labour | William Walton | 246 | |||
| Turnout | 3,833 | 35 | |||
| Independent gain from Liberal Democrats | Swing | ||||
| Independent gain from Labour | Swing | ||||
| Labour hold | Swing | ||||
External links
- BBC report of 2003 Allerdale election results BBC News
- Election results from Allerdale Council website
This article is issued from Wikipedia. The text is licensed under Creative Commons - Attribution - Sharealike. Additional terms may apply for the media files.